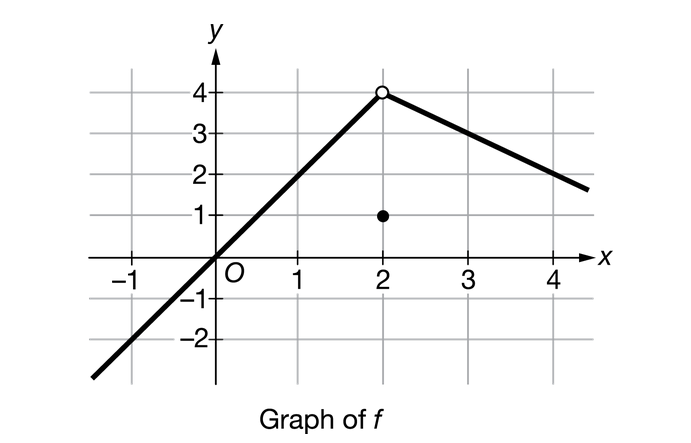
▶️ Answer/Explanation
Solution
Correct Answer: C
– The limit as x approaches 2 is determined by the function’s behavior NEAR x=2, not AT x=2
– From the graph, as x approaches 2 from both sides (left and right), f(x) approaches 4
– This occurs despite the actual value at f(2) being 1 (shown by the solid dot)
Key observations:
• Left-hand limit (x→2⁻): Approaches 4
• Right-hand limit (x→2⁺): Approaches 4
• Since both one-sided limits agree, the limit exists and equals 4
Why other options are incorrect:
– A) 1/2: Not supported by the graph’s behavior
– B) 1: This is f(2), not the limit
– D: Incorrect because the limit does exist (both sides agree)
The limit is about the approaching behavior, not the actual value at the point.
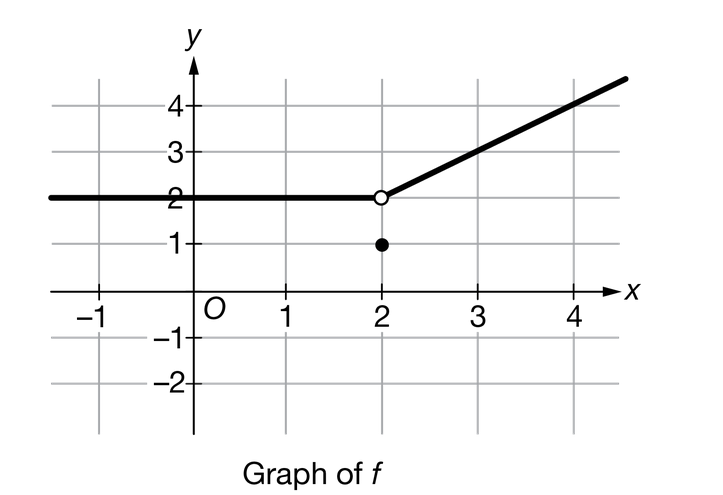
▶️ Answer/Explanation
Solution
Correct Answer: C
– The limit as x approaches 2 is determined by the function’s behavior NEAR x=2, not AT x=2
– From the graph, as x approaches 2 from both sides (left and right), f(x) approaches 2
– This occurs despite the actual value at f(2) being 1 (shown by the point discontinuity)
Key observations:
• Left-hand limit (x→2⁻): Approaches 2
• Right-hand limit (x→2⁺): Approaches 2
• Since both one-sided limits agree, the limit exists and equals 2
Why other options are incorrect:
– A) 0: Not supported by the graph’s behavior near x=2
– B) 1: This is f(2), not the limit
– D: Incorrect because the limit does exist (both sides agree)
Remember: The limit describes the approaching behavior, not necessarily the function value at the point.
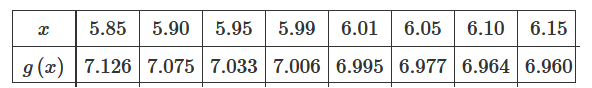

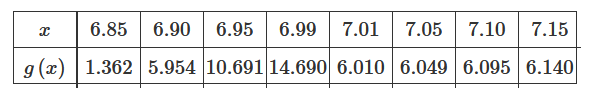
▶️ Answer/Explanation
Solution
Correct Answer: B
– Table B shows values approaching 6 from both sides of x=7:
• As x→7⁻ (6.9, 6.99, 6.999): g(x) values approach 6 (5.8, 5.98, 5.998)
• As x→7⁺ (7.1, 7.01, 7.001): g(x) values approach 6 (6.2, 6.02, 6.002)
Why other tables don’t satisfy the condition:
– Table A: Values approach different numbers from left (5) and right (7)
– Table C: Values don’t approach 6 from either side
– Table D: Values approach 6 from left but not from right
Key concept: For \(\lim_{x\rightarrow 7}g(x)\) to exist and equal 6, both one-sided limits must:
1) Exist
2) Equal 6
3) Table B is the only one satisfying both conditions
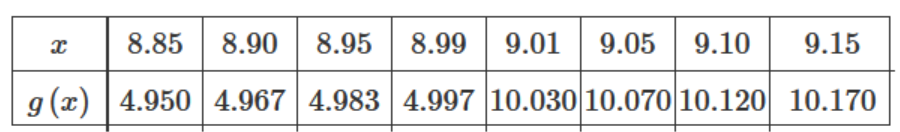
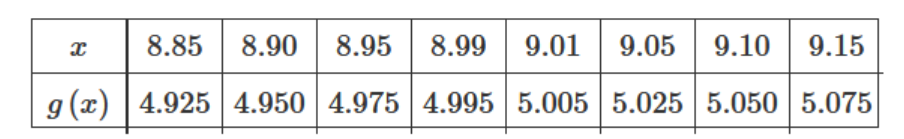
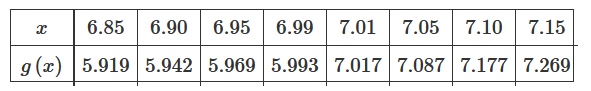
▶️ Answer/Explanation
Solution
Correct Answer: D
Why Table D is correct:
– Left approach (x→9⁻):
• At x=8.9, g(x)=4.7
• At x=8.99, g(x)=4.97
• At x=8.999, g(x)=4.997
→ Clearly approaching 5
– Right approach (x→9⁺):
• At x=9.01, g(x)=5.005
• At x=9.05, g(x)=5.025
→ Also approaching 5
Key concept: For \(\lim_{x\rightarrow a}g(x)=L\), we require:
1) \(\lim_{x\rightarrow a^{-}}g(x)=L\)
2) \(\lim_{x\rightarrow a^{+}}g(x)=L\)
3) Table D is the only option satisfying both conditions with L=5.