Question
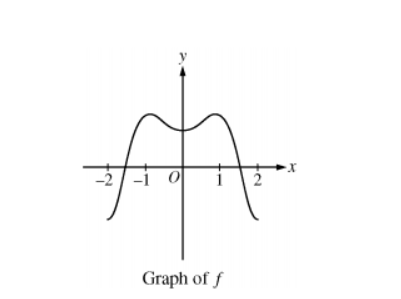
The graph of the function f is shown above for \(-2\leq x\leq 2\) . Which of the following could be the graph of an antiderivative of f ?
A 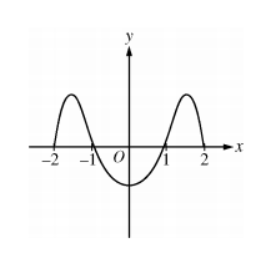
B 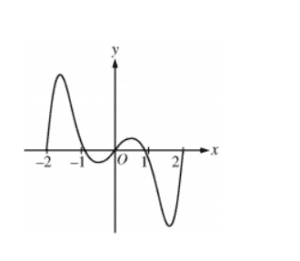
C 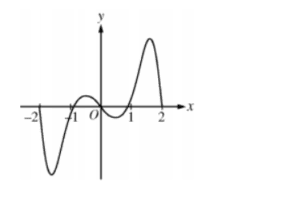
D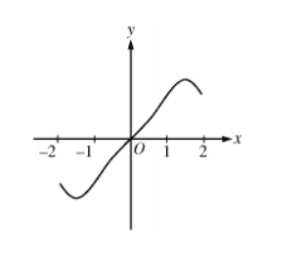
▶️Answer/Explanation
Ans:D
Question

The graph of y=h(x) is shown above. Which of the following could be the graph of \(y=h{}'(x)\)?
A 
B 
C
D
E 
▶️Answer/Explanation
Ans:E
Question

The graph of y = f(x) on the closed interval [0, 4] is shown above. Which of the following could be the graph y = f'(x)?
A
B 
C
D
E 
▶️Answer/Explanation
Ans:D