Sketching Graphs of Functions and Their Derivatives
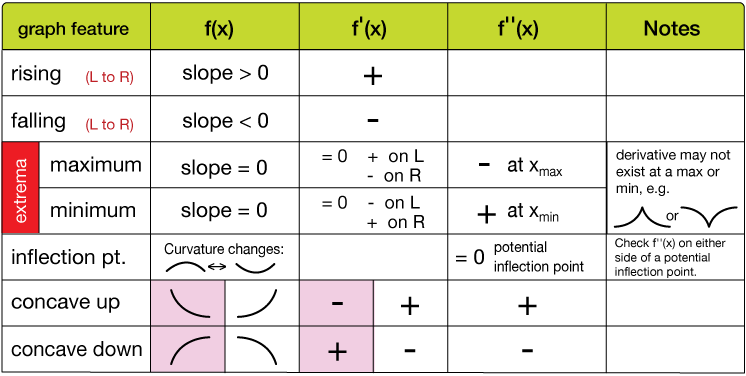
Key features of a function \( f(x) \), its first derivative \( f'(x) \), and second derivative \( f”(x) \) can be interpreted and related across graphical, numerical, and analytical forms. These interpretations help us understand the function’s behavior:
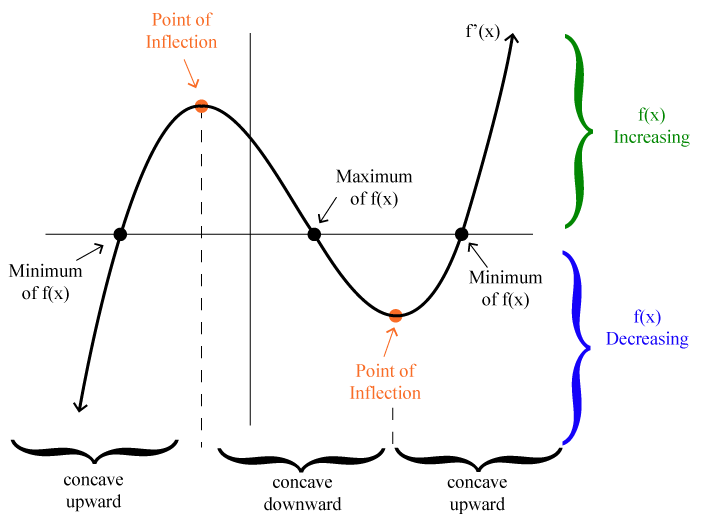
- Zeros of \( f'(x) \): Indicate possible local maxima or minima of \( f(x) \).
- Sign of \( f'(x) \): Determines whether \( f(x) \) is increasing or decreasing.
- Zeros of \( f”(x) \): Indicate possible points of inflection of \( f(x) \).
- Sign of \( f”(x) \): Determines whether \( f(x) \) is concave up or concave down.
Relationships among \( f \), \( f’ \), and \( f” \):
| Behavior of \( f(x) \) | Sign of \( f'(x) \) | Sign of \( f”(x) \) |
|---|---|---|
| Increasing | Positive | — |
| Decreasing | Negative | — |
| Concave Up | — | Positive |
| Concave Down | — | Negative |
The general approach to curve sketching
Example:
Find the inflection point(s) of the function \( f(x) = x^3 + x^2 – 9x – 9 \), and show that the curvature (concavity) changes from positive to negative across that point. Sketch a graph of the function and its first and second derivatives.
▶️Answer/Explanation
Start by finding \( f'(x) \) and \( f”(x) \):
\( f(x) = x^3 + x^2 – 9x – 9 \) \( f'(x) = 3x^2 + 2x – 9 \) \( f”(x) = 6x + 2 \)
Inflection Point(s)
Set \( f”(x) = 0 \) to find potential inflection points:
\( 6x + 2 = 0 \Rightarrow x = -\frac{1}{3} \)
Test Concavity Around \( x = -\frac{1}{3} \)
For \( x < -\frac{1}{3} \), choose \( x = -1 \):
\( f”(-1) = 6(-1) + 2 = -4 \) → Concave down
For \( x > -\frac{1}{3} \), choose \( x = 0 \):
\( f”(0) = 6(0) + 2 = 2 \) → Concave up
This shows a change in concavity from down to up, confirming an inflection point at \( x = -\frac{1}{3} \).
Find the corresponding \( y \)-value:
\( f\left(-\frac{1}{3}\right) = \left(-\frac{1}{3}\right)^3 + \left(-\frac{1}{3}\right)^2 – 9\left(-\frac{1}{3}\right) – 9 \)
\( = -\frac{1}{27} + \frac{1}{9} + 3 – 9 = -\frac{1}{27} + \frac{3}{27} + 3 – 9 = \frac{2}{27} – 6 = -\frac{160}{27} \)
So, the inflection point is at: \( \left(-\frac{1}{3}, -\frac{160}{27}\right) \)
Graph: Below is a sketch of \( f(x) \), \( f'(x) \), and \( f”(x) \).
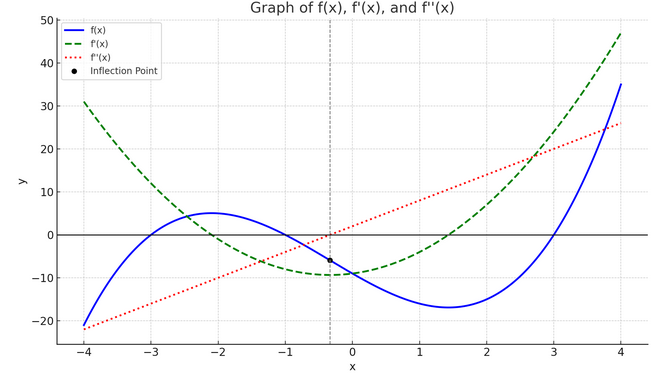
Notice how the second derivative crosses the x-axis at \( x = -\frac{1}{3} \), indicating the inflection point.
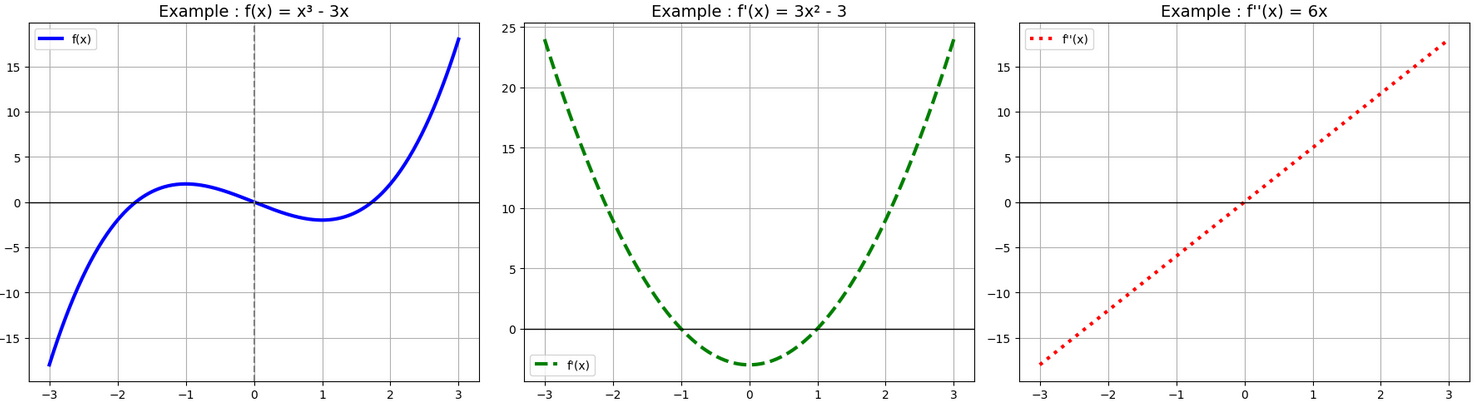
Example :
Given the function \( f(x) = x^3 – 3x \), sketch the graphs of \( f(x) \), \( f'(x) \), and \( f”(x) \).
▶️Answer/Explanation
First Derivative
\( f'(x) = \frac{d}{dx}(x^3 – 3x) = 3x^2 – 3 \)
Set \( f'(x) = 0 \): \( 3x^2 – 3 = 0 \Rightarrow x^2 = 1 \Rightarrow x = \pm1 \)
Critical points: \( x = -1 \), \( x = 1 \)
Test intervals:
\( f'(x) < 0 \) for \( x < -1 \) and \( x > 1 \) → decreasing
\( f'(x) > 0 \) for \( -1 < x < 1 \) → increasing
So: local max at \( x = -1 \), local min at \( x = 1 \)
Second Derivative
\( f”(x) = \frac{d}{dx}(3x^2 – 3) = 6x \) – Set \( f”(x) = 0 \): \( 6x = 0 \Rightarrow x = 0 \)
Inflection point at \( x = 0 \)
\( f”(x) > 0 \) for \( x > 0 \): concave up
\( f”(x) < 0 \) for \( x < 0 \): concave down
Key Features of \( f(x) = x^3 – 3x \):
Turning points at \( x = -1 \), \( x = 1 \)
Inflection point at \( x = 0 \)
Symmetric about origin (odd function) – Sketch shows an “S”-shaped curve crossing the x-axis at \( x = -\sqrt{3}, 0, \sqrt{3} \)
Example:
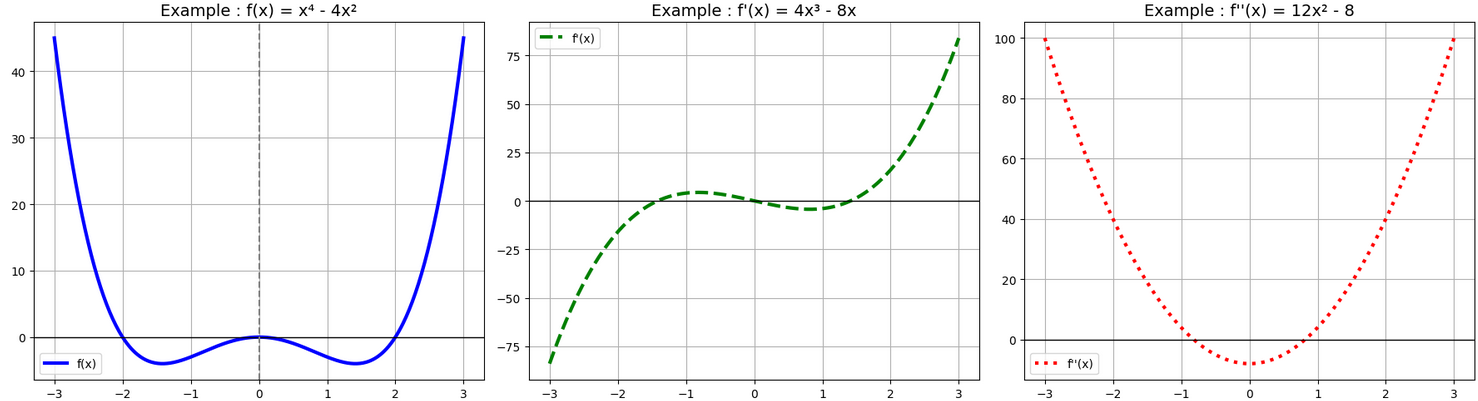
Given the function \( f(x) = x^4 – 4x^2 \), sketch the graphs of \( f(x) \), \( f'(x) \), and \( f”(x) \).
▶️Answer/Explanation
First Derivative
\( f'(x) = \frac{d}{dx}(x^4 – 4x^2) = 4x^3 – 8x \) – Set \( f'(x) = 0 \): \( 4x(x^2 – 2) = 0 \Rightarrow x = 0, \pm\sqrt{2} \)
Critical points at \( x = -\sqrt{2}, 0, \sqrt{2} \)
Sign of \( f'(x) \):
\( f'(x) < 0 \) in intervals \( (-\infty, -\sqrt{2}) \), \( (0, \sqrt{2}) \) → decreasing
\( f'(x) > 0 \) in \( (-\sqrt{2}, 0) \), \( (\sqrt{2}, \infty) \) → increasing
So: – Local minimum at \( x = -\sqrt{2} \)
Local maximum at \( x = 0 \)
Local minimum at \( x = \sqrt{2} \)
Second Derivative\( f”(x) = \frac{d}{dx}(4x^3 – 8x) = 12x^2 – 8 \)
Set \( f”(x) = 0 \): \( 12x^2 = 8 \Rightarrow x^2 = \frac{2}{3} \Rightarrow x = \pm\sqrt{\frac{2}{3}} \)
Inflection points at \( x = \pm\sqrt{2/3} \)
Summary of \( f(x) = x^4 – 4x^2 \):
Turning points at \( x = -\sqrt{2}, 0, \sqrt{2} \)
Inflection points at \( x = \pm\sqrt{2/3} \)
Symmetric about y-axis (even function)
Graph shape: “W”-like curve with two minima, one central max