Exploring Accumulations of Change
The accumulation of change represents the total change in a quantity over an interval of time. If a function \( f(t) \) gives the rate of change of a quantity, then the total accumulated change from time \( a \) to \( b \) is given by the definite integral:
\( \text{Accumulated change} = \displaystyle \int_a^b f(t)\,dt \)
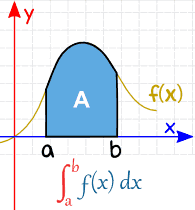
Geometrically, this is the net area between the curve \( f(t) \) and the x-axis over the interval \( [a, b] \):
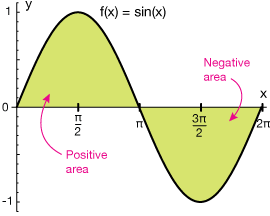
- Area above the x-axis contributes positive change.
- Area below the x-axis contributes negative change.
This concept is used in real-life to compute:
- Total distance traveled from velocity
- Total volume from flow rate
- Total growth from growth rate functions in biology, economics, etc.
Note: The definite integral of a rate function gives the net change in the original quantity.
Example :
A car’s velocity (in m/s) over time is given by \( v(t) = 3t^2 \) for \( 0 \leq t \leq 4 \). Find the total change in position of the car from \( t = 0 \) to \( t = 4 \).
▶️Answer/Explanation
We are given the rate function \( v(t) = 3t^2 \).
The position function is the accumulation of velocity: \( \text{Displacement} = \displaystyle \int_0^4 3t^2\,dt \)
Use the power rule: \( \displaystyle \int 3t^2\,dt = t^3 \) So, \( \displaystyle \int_0^4 3t^2\,dt = 4^3 – 0^3 = 64 \)
The total change in position is 64 meters.
Example :
Water flows into a tank at a rate of \( r(t) = 5\cos\left(\dfrac{\pi t}{6}\right) \) liters per minute for \( 0 \leq t \leq 6 \). How much water enters the tank during that time?
▶️Answer/Explanation
We calculate the accumulation of flow rate: \( \text{Volume} = \displaystyle \int_0^6 5\cos\left(\dfrac{\pi t}{6}\right)\,dt \)
Let’s factor the constant: \( = 5 \displaystyle \int_0^6 \cos\left(\dfrac{\pi t}{6}\right)\,dt \)
Let \( u = \dfrac{\pi t}{6} \Rightarrow du = \dfrac{\pi}{6}dt \Rightarrow dt = \dfrac{6}{\pi}du \)
When \( t = 0 \Rightarrow u = 0 \), and when \( t = 6 \Rightarrow u = \pi \)
Now the integral becomes: \( 5 \cdot \dfrac{6}{\pi} \displaystyle \int_0^{\pi} \cos(u)\,du = \dfrac{30}{\pi} \left[\sin(u)\right]_0^{\pi} = \dfrac{30}{\pi}(\sin \pi – \sin 0) = 0 \)
So, the net amount of water added is 0 liters — inflow and outflow cancel out over this interval.
Accumulation Using Geometry
In some cases, the accumulated change can be evaluated by calculating the area using basic geometric shapes, such as triangles, rectangles, or trapezoids.
If the graph of the rate function is simple (e.g. straight lines or constant rates), we can compute the total change by calculating the area under the curve using geometry instead of calculus.
Sign of Accumulated Change
If the rate function \( f(t) \) is:
- Positive on an interval, then the accumulation is positive.
- Negative on an interval, then the accumulation is negative.
In such cases, we can find the net change by subtracting areas below the x-axis from those above the x-axis.
Example:
The graph of a rate function \( r(t) \) is a straight line from the origin to the point \( (4, 2) \), and then drops straight to the x-axis at \( (6, 0) \). Find the total accumulation over \( t = 0 \) to \( t = 6 \) using geometry.
▶️Answer/Explanation
We divide the region into two triangles:
- First triangle from \( t = 0 \) to \( t = 4 \): base = 4, height = 2
- Second triangle from \( t = 4 \) to \( t = 6 \): base = 2, height = 2
Use the area of a triangle
\( A = \dfrac{1}{2} \times \text{base} \times \text{height} \):
\( \text{Area}_1 = \dfrac{1}{2} \times 4 \times 2 = 4 \\ \text{Area}_2 = \dfrac{1}{2} \times 2 \times 2 = 2 \)
\( \text{Total Accumulation} = 4 + 2 = 6 \)
So, the total accumulation is 6 units.