▶️ Answer/Explanation
Solution
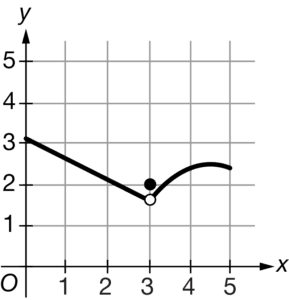
1. Graph Analysis: The graph shows continuity at \( x = 3 \) with values approaching approximately 1.6 from both sides.
2. Table Analysis: As \( x \) approaches 3 from both sides (2.998 → 3.002), \( f(x) \) approaches ≈1.6.
3. Linear Segment Calculation:
- Slope \( m = \frac{1.625 – 1.650}{2.95 – 2.9} = -0.5 \)
- Equation: \( y = -0.5(x – 2.9) + 1.65 \)
- At \( x = 3 \): \( y = -0.5(0.1) + 1.65 = 1.6 \)
4. Conclusion: The limit exists and equals 1.6.
✅ Answer: A) 1.6
▶️ Answer/Explanation
Solution
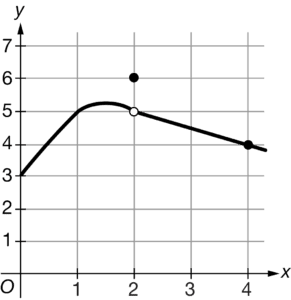
1. Evaluate \( \lim_{x \to 2} f(x) \):
- Left limit (\( x \to 2^- \)): Use \(-x^2 + 3x + 3\) → \(-4 + 6 + 3 = 5\)
- Right limit (\( x \to 2^+ \)): Use \(6 – \frac{1}{2}x\) → \(6 – 1 = 5\)
- Since both limits equal 5, \( \lim_{x \to 2} f(x) = 5 \).
2. Compute \( f(f(x)) \) as \( x \to 2 \):
- Since \( f(x) \to 5 \) as \( x \to 2 \), evaluate \( f(5) \):
- For \( x = 5 > 2 \), use \( 6 – \frac{1}{2}x \) → \( 6 – 2.5 = 3.5 = \frac{7}{2} \).
3. Conclusion:
\[ \lim_{x \rightarrow 2} f(f(x)) = f(5) = \frac{7}{2} \]
✅ Answer: D) \( \frac{7}{2} \)
▶️ Answer/Explanation
Solution
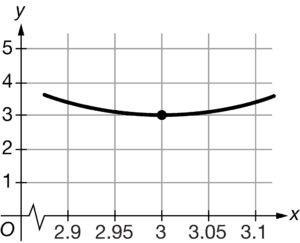
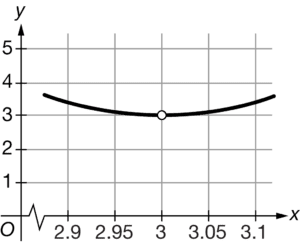
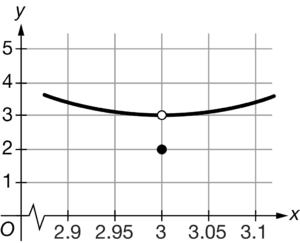
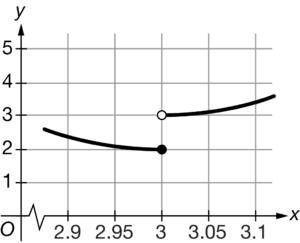
1. Table Analysis:
- As \( x \) approaches 3 from both sides, \( f(x) \) approaches 3.
- The values are symmetric around \( x = 3 \), suggesting continuity.
2. Graph Requirements:
- The correct graph must show \( f(x) \rightarrow 3 \) as \( x \rightarrow 3 \).
- Graph D shows a jump discontinuity at \( x = 3 \), which contradicts the table data.
3. Conclusion:
Graph D could not represent \( f \) because it violates the limit behavior shown in the table.
✅ Answer: D)