The Ideal Gas Law
The behavior of an ideal gas—a hypothetical gas that obeys all gas laws perfectly is described by the equation:
\( \mathrm{PV = nRT} \)
- \( \mathrm{P} \): Pressure of the gas
- \( \mathrm{V} \): Volume of the gas
- \( \mathrm{n} \): Moles of gas
- \( \mathrm{R} \): Ideal gas constant (\( \mathrm{8.314 \, J\,mol^{-1}K^{-1}} \) or \( \mathrm{0.0821 \, L·atm·mol^{-1}·K^{-1}} \))
- \( \mathrm{T} \): Temperature (in kelvin)
Key Properties:
- The equation relates four macroscopic properties of a gas: pressure, volume, temperature, and amount.
- It assumes gas particles have negligible volume and no intermolecular attractions.
- Under these conditions, gases behave ideally—particularly at high temperature and low pressure.
Note: The Ideal Gas Law is a unifying relationship that connects all simple gas laws. It assumes ideal behavior—no intermolecular forces and negligible particle volume.
Example :
A 2.0 mol sample of gas occupies a 10.0 L container at 300 K. Find the pressure of the gas.
▶️ Answer/Explanation
Step 1: Use the Ideal Gas Law: \( \mathrm{PV = nRT} \).
Step 2: Substitute values: \( \mathrm{P = \dfrac{nRT}{V}} = \dfrac{(2.0)(0.0821)(300)}{10.0} \).
Step 3: \( \mathrm{P = 4.92 \, atm} \).
Final Answer: The gas exerts a pressure of \( \mathrm{4.92 \, atm} \).
Partial Pressures and Mixtures of Gases
In a mixture of ideal gases, each component exerts a pressure that depends only on its own amount, temperature, and volume—independent of other gases. This pressure is called the partial pressure.
Key Relationships: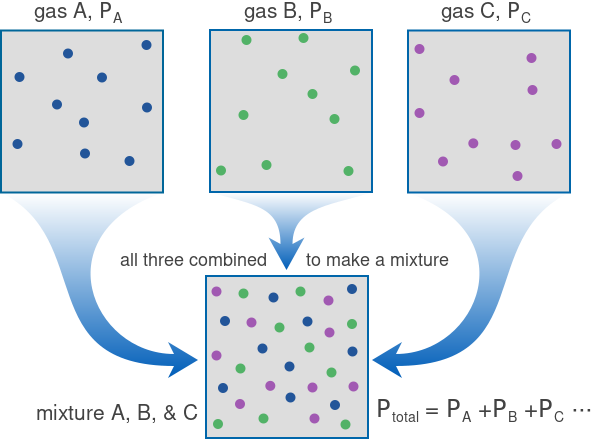
Dalton’s Law of Partial Pressures:
\( \mathrm{P_{total} = P_A + P_B + P_C + …} \)
Partial Pressure of Component A:
\( \mathrm{P_A = X_A \, P_{total}} \)
- \( \mathrm{X_A} \): mole fraction of component A = \( \mathrm{\dfrac{n_A}{n_{total}}} \)
Each gas behaves independently and contributes proportionally to its mole fraction.
Note: In a gas mixture, each gas behaves as if it alone occupies the container. The total pressure equals the sum of all individual (partial) pressures.
Example :
A container holds a mixture of 2.0 mol of \(\mathrm{N_2}\) and 1.0 mol of \(\mathrm{O_2}\) at a total pressure of 3.0 atm. Find the partial pressures of each gas.
▶️ Answer/Explanation
Step 1: Calculate mole fractions:
\( \mathrm{X_{N_2} = \frac{2.0}{3.0} = 0.667, \quad X_{O_2} = \frac{1.0}{3.0} = 0.333.} \)
Step 2: Apply Dalton’s law:
\( \mathrm{P_{N_2} = 0.667(3.0) = 2.0 \, atm, \quad P_{O_2} = 0.333(3.0) = 1.0 \, atm.} \)
Final Answer: \( \mathrm{P_{N_2} = 2.0 \, atm, \; P_{O_2} = 1.0 \, atm.} \)
Graphical Representations of Gas Behavior
Graphical plots of gas properties such as pressure (P), volume (V), temperature (T), and amount (n) visually describe the relationships defined by the gas laws.
Key Relationships and Graphs:
1. Boyle’s Law (constant T, n):

- \( \mathrm{P \propto \frac{1}{V}} \) → as pressure increases, volume decreases.
- Graph of \( \mathrm{P \, vs. \, V} \) → hyperbolic curve.
- Graph of \( \mathrm{P \, vs. \, 1/V} \) → straight line.


2. Charles’s Law (constant P, n):

- \( \mathrm{V \propto T} \) → volume increases linearly with temperature (in kelvin).
- Graph of \( \mathrm{V \, vs. \, T} \) → straight line passing through origin (at T = 0 K, V → 0).

3. Gay-Lussac’s Law (constant V, n):

- \( \mathrm{P \propto T} \) → pressure increases linearly with temperature.
- Graph of \( \mathrm{P \, vs. \, T} \) → straight line through origin.

4. Avogadro’s Law (constant P, T):

- \( \mathrm{V \propto n} \) → volume is directly proportional to moles of gas.
- Graph of \( \mathrm{V \, vs. \, n} \) → straight line.

Key Idea: Graphical analysis helps visualize direct and inverse relationships among gas variables. Straight-line relationships indicate proportionality; curved ones indicate inverse behavior (like in Boyle’s law).
Gas Law Relationships
| Gas Law | Variables Held Constant | Mathematical Relationship | Graph Type |
|---|---|---|---|
| Boyle’s Law | T, n | \( \mathrm{P \propto \frac{1}{V}} \) | Inverse curve |
| Charles’s Law | P, n | \( \mathrm{V \propto T} \) | Linear |
| Gay-Lussac’s Law | V, n | \( \mathrm{P \propto T} \) | Linear |
| Avogadro’s Law | P, T | \( \mathrm{V \propto n} \) | Linear |
Example :
Sketch and interpret a plot of pressure versus volume for a gas at constant temperature.
▶️ Answer/Explanation
Step 1: According to Boyle’s Law, \( \mathrm{P \propto 1/V} \).
Step 2: The curve decreases asymptotically — as volume increases, pressure decreases.
Step 3: The area under each curve (PV) remains constant for the same temperature.
Final Answer: The \( \mathrm{P \, vs. \, V} \) plot is a hyperbolic curve showing inverse proportionality, illustrating Boyle’s Law.