Photoelectron Spectroscopy (PES)
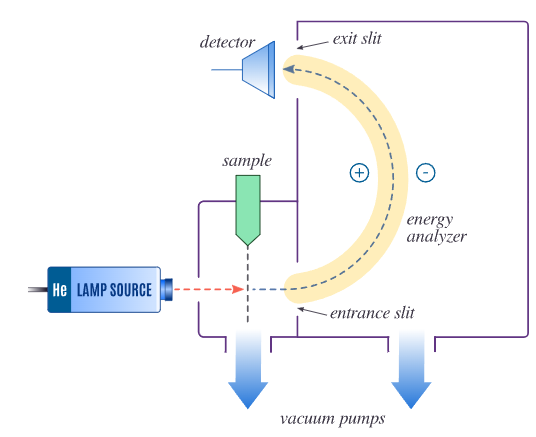
Photoelectron spectroscopy is an experimental technique used to measure the energies of electrons in atoms and ions. High-energy photons (usually ultraviolet or X-rays) strike the atom, causing electrons to be ejected. The kinetic energy of the emitted electron is measured and used to calculate the binding (ionization) energy.
The Photoelectric Effect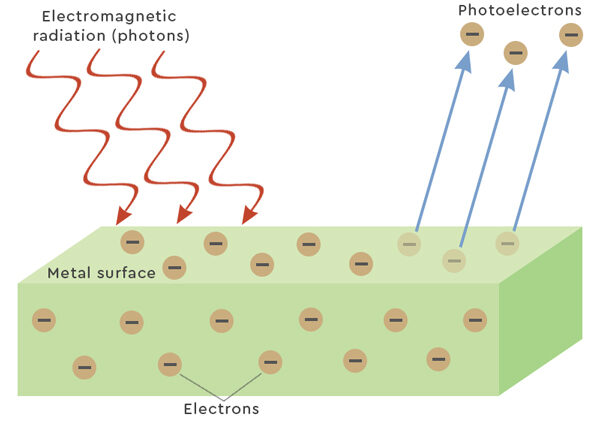
When a photon of energy \( E_{photon} \) hits an atom:
\( E_{photon} = E_{binding} + E_{kinetic} \)
- \( E_{binding} \): the energy holding the electron in the atom (ionization energy).
- \( E_{kinetic} \): the measured kinetic energy of the ejected electron.
Thus, the binding energy can be determined as:
\( E_{binding} = E_{photon} – E_{kinetic} \)
Photoelectron Spectrum
A photoelectron spectrum is a graph with:
- x-axis: Binding energy (in eV).
- y-axis: Relative number of electrons detected (intensity/peaks).
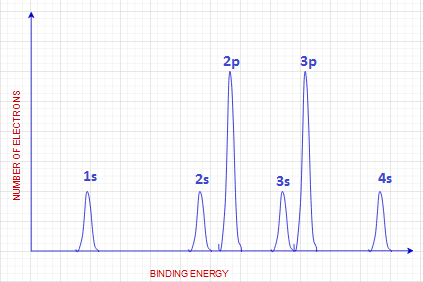
Each peak corresponds to electrons from a specific subshell (1s, 2s, 2p, etc.).
The area under a peak = number of electrons in that subshell.
Relationship to Ground-State Electron Configuration
- Peaks in the spectrum correspond directly to subshells in the electron configuration.
- For example, a peak with 2 electrons → s subshell; a peak with 6 electrons → p subshell.
- The relative sizes of the peaks match the number of electrons in each subshell.
- The order of binding energies reflects the relative distances of the subshells from the nucleus: \( 1s > 2s > 2p > 3s \), etc.
Coulomb’s Law and Electron-Nucleus Interaction
PES data can be explained by Coulomb’s law:
\( F = k \dfrac{q_1 q_2}{r^2} \)
- Electrons closer to the nucleus (smaller \( r \)) experience stronger attraction → higher binding energy.
- Greater effective nuclear charge (\( Z_{eff} \)) increases attraction → higher binding energy.
- Core electrons show much higher binding energies than valence electrons.
- Shielding by inner electrons reduces nuclear attraction felt by outer electrons, giving them lower binding energies.
Example
The photoelectron spectrum of oxygen shows two main peaks: one at high binding energy (2 electrons) and one at lower binding energy (6 electrons). Explain how this relates to the electron configuration of oxygen.
▶️ Answer/Explanation
Oxygen electron configuration: \( 1s^2 2s^2 2p^4 \).
• The high-energy (large binding energy) peak corresponds to 1s electrons (2 electrons).
• The lower-energy peaks correspond to 2s (2 electrons) and 2p (4 electrons).
• Thus, the spectrum directly confirms the ground-state configuration.
Example
Why do the 1s electrons in oxygen have a much higher binding energy than the 2p electrons?
▶️ Answer/Explanation
The 1s electrons are closer to the nucleus (smaller \( r \)) and experience little shielding, so they feel nearly the full nuclear charge. According to Coulomb’s law, this strong attraction gives them a very high binding energy. The 2p electrons are farther from the nucleus and shielded by 1s and 2s electrons, so their binding energy is lower.