Questions
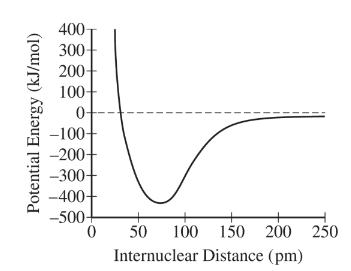
Which of the following can be inferred from the diagram above that shows the dependence of potential energy on the internuclear distance between two atoms?
(A) The atoms form a bond with a bond length of 25 pm.
(B) The atoms form a bond with a bond length of 75 pm.
(C) The net force between the atoms is attractive at 25 pm.
(D) The net force between the atoms is attractive at 75 pm.
▶️Answer/Explanation
Ans: B
To determine the bond length using a graph that shows the dependence of potential energy on the internuclear distance between two atoms (commonly known as a potential energy curve or a potential energy
surface), we look for the point on the curve where the potential energy is at its minimum.
In a stable molecule, the bond length corresponds to the distance between the two atoms where the potential energy is at its minimum. This minimum represents the equilibrium bond length, where the
attractive and repulsive forces between the atoms are balanced.
Therefore, from the graph:
. The bond length can be inferred as the internuclear distance at which the potential energy is minimized.
. At this point, the potential energy reaches its lowest value, indicating a stable configuration of the molecule.
. The bond length can be identified by locating the minimum point on the curve, which represents the distance between the atoms when they are bonded together in the most stable configuration.
The bond length of the atoms is not given by the specific distances of 75 pm but is indicated by the minimum point on the potential energy curve, which is the most stable arrangement of the atoms and
corresponds to the bond length.
Question
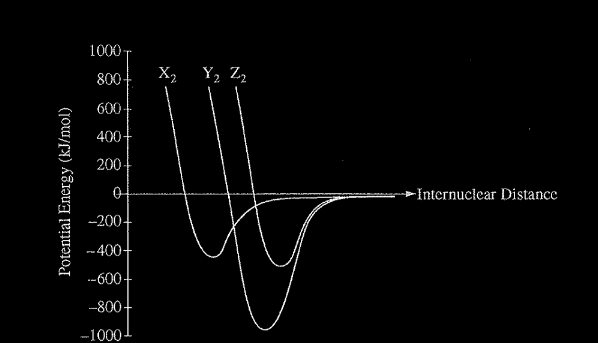
The potential energy as a function of internuclear distance for three diatomic molecules,\( X_2\), \(Y_2\), and \(Z_2\), is shown in the graph above. Based on the data in the graph, which of the following correctly identifies the diatomic molecules, \(X_2\),\( Y_{2}\), and \(Z_2\)?
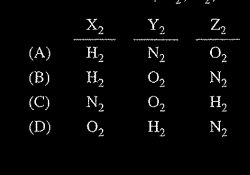
▶️Answer/Explanation
Ans:A