Energy Diagrams for Physical and Chemical Transformations
Every physical or chemical process can be represented using an energy diagram, which shows the change in potential energy of the system as it progresses from reactants to products. This visual model helps determine whether the process is endothermic or exothermic and how much energy is required to initiate it.
An energy diagram is a graph of potential energy (y-axis) versus reaction progress (x-axis). It identifies the energy of the reactants, products, and the activation energy barrier \( \mathrm{(E_a)} \) that must be overcome for the reaction or process to occur.
\( \mathrm{\Delta H = E_{products} – E_{reactants}} \)
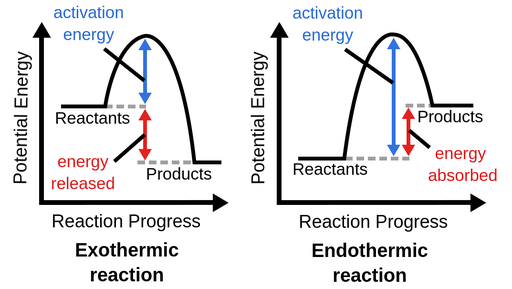
- If \( \mathrm{\Delta H < 0} \): Exothermic process → energy released; products lower in energy than reactants.
- If \( \mathrm{\Delta H > 0} \): Endothermic process → energy absorbed; products higher in energy than reactants.
- The peak represents the activation energy \( \mathrm{(E_a)} \), the minimum energy needed for effective collisions.
- The difference between reactant and product levels corresponds to the enthalpy change \( \mathrm{(\Delta H)} \).
Key Idea: Energy diagrams illustrate the energy profile of a process. The magnitude and sign of \( \mathrm{\Delta H} \) determine if energy is released or absorbed, while the height of the activation energy peak controls how fast the process occurs.
| Process Type | Energy Change | Diagram Feature | Example |
|---|---|---|---|
| Exothermic | \( \mathrm{\Delta H < 0} \) | Products lower in energy; energy released | Combustion of methane, condensation |
| Endothermic | \( \mathrm{\Delta H > 0} \) | Products higher in energy; energy absorbed | Photosynthesis, melting of ice |
| Activation Energy | \( \mathrm{E_a} \) | Peak of curve; determines rate of reaction | Lowered by catalysts |
Example :
A student mixes barium hydroxide and ammonium chloride in a beaker and observes that the beaker becomes cold to the touch. Represent this process on an energy diagram and classify the process.
▶️ Answer/Explanation
Step 1: Beaker becomes cold → system absorbs heat from surroundings.
Step 2: Energy absorbed means endothermic process (\( \mathrm{\Delta H > 0} \)).
Step 3: Diagram: products higher in energy than reactants; upward energy change corresponds to \( \mathrm{\Delta H} \).
Step 4: The peak shows activation energy — minimum energy required for the process.
Final Answer: Reaction is endothermic — energy absorbed makes the beaker cold.
Example :
The combustion of propane (\( \mathrm{C_3H_8 + 5O_2 \rightarrow 3CO_2 + 4H_2O} \)) releases 2220 kJ/mol of propane burned. Represent this reaction on an energy diagram and explain its features.
▶️ Answer/Explanation
Step 1: Heat is released → exothermic process (\( \mathrm{\Delta H = -2220\ kJ/mol} \)).
Step 2: Diagram: products lie below reactants; the energy difference equals \( \mathrm{|\Delta H|} \).
Step 3: Activation energy \( \mathrm{E_a} \) still required to start the reaction (spark provides energy to break bonds).
Step 4: Once the reaction begins, it releases energy continuously — sustaining combustion.
Final Answer: Exothermic — large negative \( \mathrm{\Delta H} \) corresponds to energy released as heat and light.