Reversible Processes and Dynamic Equilibrium
A process is reversible when both the forward and reverse reactions can occur under the same conditions. In such systems, products can reform reactants and vice versa until a state of equilibrium is established.
Examples of Reversible Processes: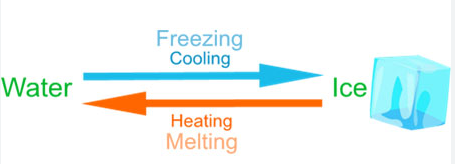
Physical Processes:
- Evaporation ⇄ Condensation of water
- Dissolution ⇄ Precipitation of a salt
- Absorption ⇄ Desorption of a gas
Chemical Processes:
- Acid–base proton transfer: \( \mathrm{HA + H_2O ⇄ H_3O^+ + A^-} \)
- Redox electron transfer: \( \mathrm{Fe^{2+} ⇄ Fe^{3+} + e^-} \)
Key Idea: A reversible process allows the system to reach a state of balance where both forward and reverse reactions continue to occur simultaneously.
Example:
Explain why the evaporation of water in a closed container is a reversible process.
▶️ Answer / Explanation
Step 1: Water molecules at the surface escape into vapor (evaporation).
Step 2: Vapor molecules collide with the liquid surface and condense back (condensation).
Step 3: When these two processes occur at the same rate, a dynamic equilibrium forms.
Final Answer: Evaporation and condensation are reversible and establish vapor–liquid equilibrium in a closed system.
Characteristics of the Equilibrium State
At equilibrium, observable properties remain constant even though both reactants and products are present. The concentrations (or partial pressures) of all species stop changing because the forward and reverse reaction rates are equal.
Key Features of Equilibrium:
- Both reactants and products coexist.
- Concentrations and pressures remain constant with time.
- No net change is observed at the macroscopic level.
- The system is in a state of minimum Gibbs free energy.
Representation of Equilibrium:
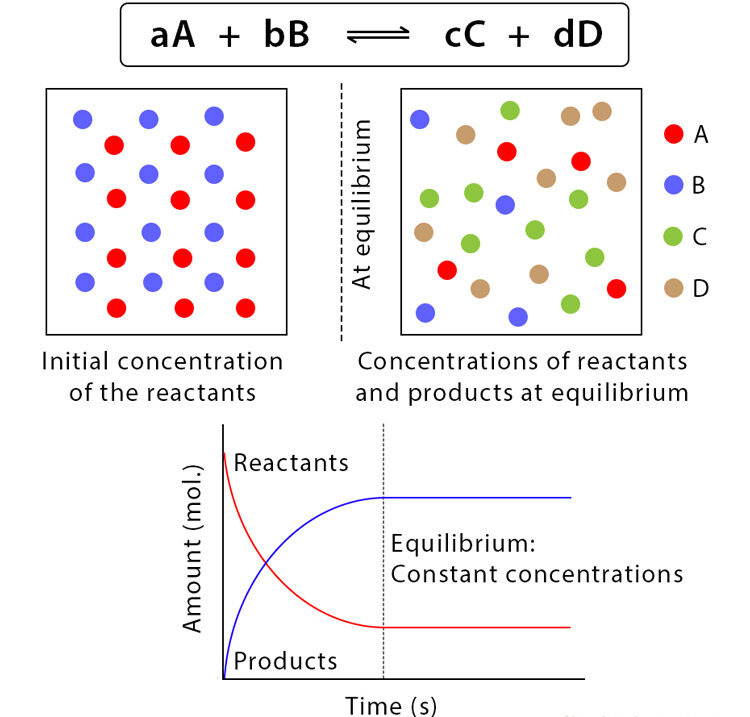
\( \mathrm{aA + bB ⇄ cC + dD} \)
At equilibrium: \( \mathrm{Rate_{forward} = Rate_{reverse}} \) and \( \mathrm{\dfrac{[C]^c [D]^d}{[A]^a [B]^b} = K} \) (constant at a fixed temperature)
Example:
In the equilibrium system \( \mathrm{N_2(g) + 3H_2(g) ⇄ 2NH_3(g)} \), what happens when equilibrium is reached?
▶️ Answer / Explanation
At equilibrium, ammonia formation and decomposition occur simultaneously at equal rates.
Thus, the partial pressures of \( \mathrm{N_2} \), \( \mathrm{H_2} \), and \( \mathrm{NH_3} \) remain constant over time.
Final Answer: No observable change occurs, but both forward and reverse reactions continue.
Dynamic Nature of Chemical Equilibrium
Equilibrium is a dynamic state — not static. Even though macroscopic properties remain unchanged, microscopic reactions continue to occur in both directions at equal rates.
Key Points:
- Equilibrium is reached when \( \mathrm{Rate_{forward} = Rate_{reverse}} \).
- No reactant or product is completely consumed.
- The system remains active at the molecular level, maintaining constant composition.
Mathematical Representation:
\( \mathrm{Rate_{fwd} = k_f [A][B]} \)
\( \mathrm{Rate_{rev} = k_r [C][D]} \)
At equilibrium: \( \mathrm{k_f [A][B] = k_r [C][D]} \)
Example:
Explain what happens at the molecular level when equilibrium is reached in the reaction \( \mathrm{2NO_2(g) ⇄ N_2O_4(g)} \).
▶️ Answer / Explanation
Step 1: Initially, \( \mathrm{NO_2} \) molecules combine rapidly to form \( \mathrm{N_2O_4} \).
Step 2: As \( \mathrm{N_2O_4} \) concentration increases, it begins to dissociate back into \( \mathrm{NO_2} \).
Step 3: Eventually, the two rates become equal, and both processes occur continuously at equal rates.
Final Answer: The system is dynamic — \( \mathrm{NO_2} \) is constantly forming and decomposing, but the overall concentrations remain unchanged.
Graphical Interpretation of Chemical Equilibrium
Graphs of concentration, partial pressure, or reaction rate versus time can be used to visualize how equilibrium is established and maintained in a chemical system.
Typical Behavior:
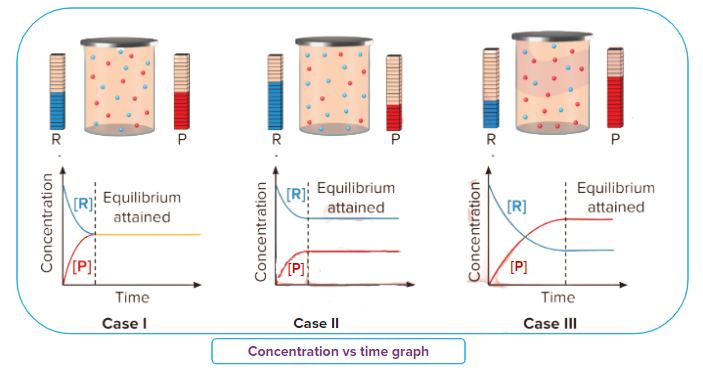
- Before equilibrium: Concentrations of reactants decrease, and products increase.
- At equilibrium: Both concentrations level off — they remain constant but not necessarily equal.
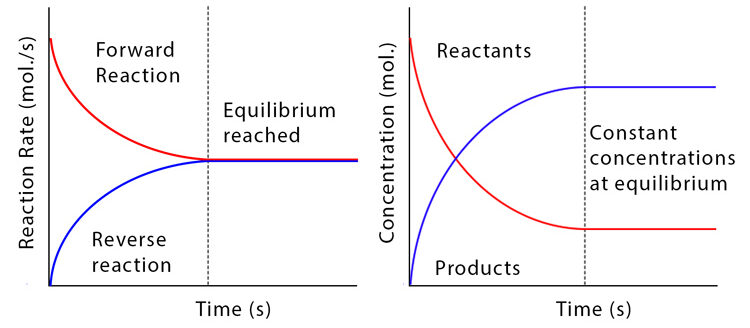
- Reaction rates: The forward and reverse reaction rates become equal.
Qualitative Features of Graphs:
- Concentration vs. time → plateau indicates equilibrium.
- Rate vs. time → intersection point where \( \mathrm{Rate_{fwd} = Rate_{rev}} \).
Example:
Describe the appearance of a concentration–time graph for the system \( \mathrm{N_2O_4(g) ⇄ 2NO_2(g)} \).
▶️ Answer / Explanation
Step 1: Initially, \( \mathrm{N_2O_4} \) decreases rapidly, and \( \mathrm{NO_2} \) increases.
Step 2: The rate of change slows down as the system approaches equilibrium.
Step 3: Both concentrations flatten and remain constant over time, indicating that equilibrium has been established.
Final Answer: At equilibrium, the graph shows flat, horizontal regions — concentrations constant, forward and reverse rates equal.