Representations of Motion
Motion can be described and analyzed using different forms of representation. Each method provides a different perspective but conveys the same physical information.
Motion Diagrams:
- Show an object’s position at successive time intervals using dots or images.
- Spacing of dots indicates speed (closer = slower, farther apart = faster).
- Useful for visualizing acceleration and direction changes.
Figures (Pictorial Diagrams):
- Sketches that show the situation (object, forces, path of motion).
- Provide a clear, intuitive picture of the problem setup.
Graphs:
- Plot physical quantities (e.g., displacement, velocity, acceleration) against time.
- Slope of a graph often gives important physical meaning:
- Slope of \(x\)-\(t\) graph → velocity
- Slope of \(v\)-\(t\) graph → acceleration
- Area under \(v\)-\(t\) graph → displacement
Equations:
- Mathematical expressions relate displacement, velocity, acceleration, and time.
- Example (constant acceleration): \( v = v_0 + at \), \( x = x_0 + v_0t + \tfrac{1}{2}at^2 \).
- Allow precise calculations and predictions.
Narrative Descriptions:
- Verbal or written explanations of how motion occurs.
- Useful for qualitative understanding before applying math.
- Example: “The car starts from rest, speeds up uniformly, and then moves with constant velocity.”
Example:
Describe Motion of a Ball Thrown Upward.
▶️Representations
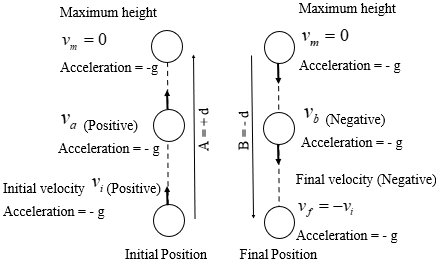
Motion Diagram: Dots get closer as the ball rises (slowing down), then farther apart as it falls (speeding up).
Graphs:
- \(x\)-\(t\): Parabola opening downward.
- \(v\)-\(t\): Straight line with negative slope.
- \(a\)-\(t\): Horizontal line at \( -g \).
Equation: \( v = v_0 – gt \), \( y = v_0t – \tfrac{1}{2}gt^2 \).
Narrative: “The ball slows as it rises, stops momentarily at the top, then speeds up downward due to gravity.”
Kinematic Equations for Constant Acceleration (1D)
- When an object moves in a straight line with constant acceleration, three key equations relate displacement, velocity, acceleration, and time.
- These are often called the SUVAT equations (because they involve: s = displacement, u = initial velocity, v = final velocity, a = acceleration, t = time).

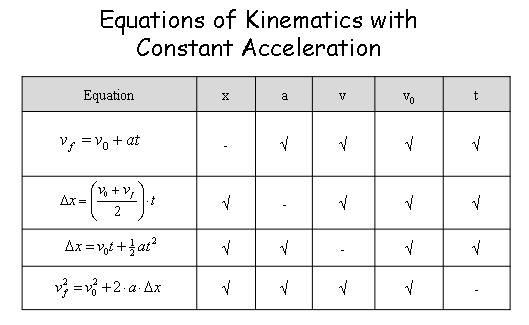
Equations:
- 1. \( v = v_0 + at \) (Relates final velocity, initial velocity, acceleration, and time)
- 2. \( x = x_0 + v_0t + \tfrac{1}{2}at^2 \) (Relates displacement, initial velocity, acceleration, and time)
- 3. \( v^2 = v_0^2 + 2a(x – x_0) \) (Relates final velocity, initial velocity, acceleration, and displacement — no time involved)
Notes:
- These equations are valid only when acceleration is constant.
- Signs (+ or –) depend on the chosen coordinate system.
- Very useful for solving linear motion problems such as free fall, uniformly accelerated cars, or projectiles in one direction.
Example :
A car starts from rest (\( v_0 = 0 \)) and accelerates uniformly at \( 2 \, \text{m/s}^2 \) for 5 s. Find the displacement.
▶️Answer/Explanation
Step (1): Use equation → \( x = x_0 + v_0t + \tfrac{1}{2}at^2 \).
Step (2): \( x = 0 + 0(5) + \tfrac{1}{2}(2)(5^2) \).
Step (3): \( x = \tfrac{1}{2} \cdot 2 \cdot 25 = 25 \, \text{m} \).
Final Answer: Displacement = 25 m.
Example :
A ball is dropped from rest and falls 20 m under gravity (\( g = 9.8 \, \text{m/s}^2 \)). Find its velocity just before hitting the ground.
▶️Answer/Explanation
Step (1): Use equation → \( v^2 = v_0^2 + 2a(x – x_0) \).
Step (2): \( v^2 = 0 + 2(9.8)(20) \).
Step (3): \( v^2 = 392 \).
Step (4): \( v = \sqrt{392} \approx 19.8 \, \text{m/s} \).
Final Answer: Final velocity ≈ 19.8 m/s downward.
Gravitational Acceleration Near Earth’s Surface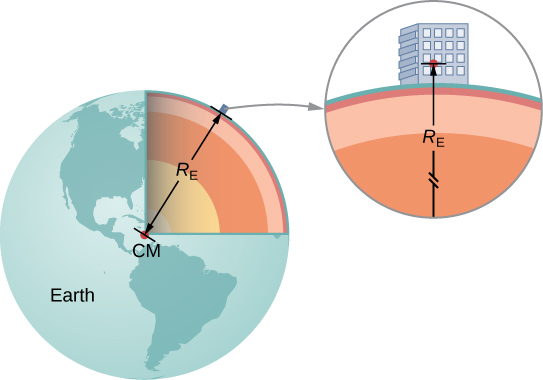
Objects near Earth’s surface experience a nearly constant acceleration due to the force of gravity.This acceleration is directed downward, toward the center of the Earth.
Its magnitude is approximately:
- \( g \approx 9.8 \, \text{m/s}^2 \) (SI units)
- Often rounded to \( 10 \, \text{m/s}^2 \) for estimation problems.
The value of \( g \) can vary slightly depending on altitude and latitude, but remains close to 9.8 \( \text{m/s}^2 \).
- This constant acceleration assumption is the basis for analyzing free-fall motion in one dimension.
Example:
An object is dropped from rest from a height of \( h = 45 \, \text{m} \). Find the time it takes to hit the ground (use \( g = 9.8 \, \text{m/s}^2 \)).
▶️Answer/Explanation
Step (1): Use displacement equation → \( x = v_0 t + \tfrac{1}{2} g t^2 \).
Step (2): Here \( v_0 = 0 \), \( x = 45 \, \text{m} \).
Step (3): \( 45 = \tfrac{1}{2}(9.8) t^2 \).
Step (4): \( 45 = 4.9 t^2 \).
Step (5): \( t^2 = \dfrac{45}{4.9} \approx 9.18 \).
Step (6): \( t \approx 3.03 \, \text{s} \).
Final Answer: The object takes about 3.0 seconds to hit the ground.
Graphs of Motion and Their Relationships
1. Displacement–Time Graphs (\(x\)-\(t\))
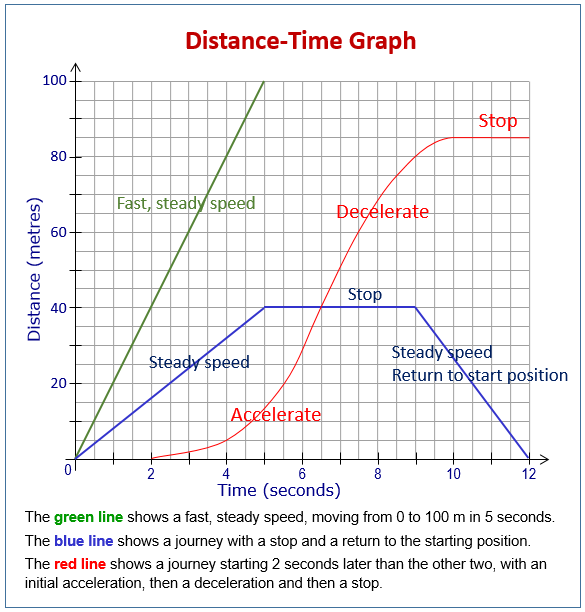
- At Rest: Horizontal line (displacement constant).
- Uniform Motion (Constant Velocity): Straight line with constant slope (slope = velocity).
- Uniform Acceleration: Curved parabola (slope increases with time → velocity increasing).
- Uniform Deceleration: Curved parabola flattening with time (slope decreases → velocity decreasing).
- Free Fall Up & Down: Curve rising (slowing down), stops, then falls faster (steeper slope).
2. Velocity–Time Graphs (\(v\)-\(t\))
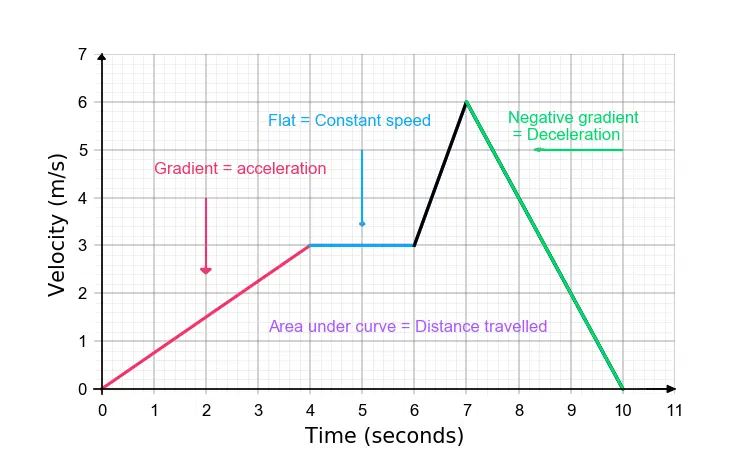
- At Rest: Line on the time axis (\(v = 0\)).
- Uniform Motion: Horizontal line parallel to time axis (\(v = \text{constant}\)).
- Uniform Acceleration: Straight line with positive slope (slope = acceleration).
- Uniform Deceleration: Straight line with negative slope.
- Free Fall: Straight line with negative slope, crossing zero at highest point, then going negative (downward velocity).
- Area under the curve = displacement.
3. Acceleration–Time Graphs (\(a\)-\(t\))

- No Acceleration (Uniform Motion): Line on time axis (\(a = 0\)).
- Uniform Acceleration: Horizontal line above time axis (positive constant).
- Uniform Deceleration: Horizontal line below time axis (negative constant).
- Non-Uniform Acceleration: Curve above or below axis, changing with time.
- Free Fall: Horizontal line at \(a = -g\).
- Area under the curve = change in velocity.
Example:
A car starts from rest and accelerates at \( 2 \, \text{m/s}^2 \) for 5 s. Sketch its motion graphs.
▶️Answer/Explanation
Displacement–Time: Parabolic curve (steeper with time).
Velocity–Time: Straight line starting at 0, reaching \( v = 10 \, \text{m/s} \) at \( t = 5 \, \text{s} \).
Acceleration–Time: Horizontal line at \( a = 2 \, \text{m/s}^2 \).
Check: – Slope of \(x\)-\(t\) matches \(v\)-\(t\).
– Slope of \(v\)-\(t\) matches \(a\)-\(t\).
– Area under \(v\)-\(t\) = displacement = \( \tfrac{1}{2} \cdot 5 \cdot 10 = 25 \, \text{m} \).
Instantaneous Velocity from Position–Time Graph
The instantaneous velocity of an object is the rate of change of its position at a specific instant of time.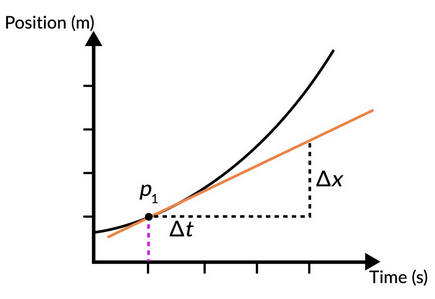
- Mathematically, it is defined as:
- \( v = \dfrac{dx}{dt} \)
- On a position–time (\(x\)-\(t\)) graph, the instantaneous velocity is equal to the slope of the tangent drawn at the point of interest.
Interpretation:
- Steeper slope → higher velocity.
- Positive slope → motion in the positive direction.
- Negative slope → motion in the opposite direction.
- Zero slope → object at rest.
This is different from average velocity, which is the slope of a secant line between two points on the graph.
Example:
A car’s position is given by \( x(t) = 5t^2 \) (meters, seconds). Find the instantaneous velocity at \( t = 4 \, \text{s} \).
▶️Answer/Explanation
Step (1): Instantaneous velocity is derivative → \( v = \dfrac{dx}{dt} \).
Step (2): \( v = \dfrac{d}{dt}(5t^2) = 10t \).
Step (3): At \( t = 4 \), \( v = 10(4) = 40 \, \text{m/s} \).
Final Answer: The car’s instantaneous velocity at \( 4 \, \text{s} \) is 40 m/s.
Instantaneous Acceleration from Velocity–Time Graph
The instantaneous acceleration of an object is the rate of change of its velocity at a specific instant of time.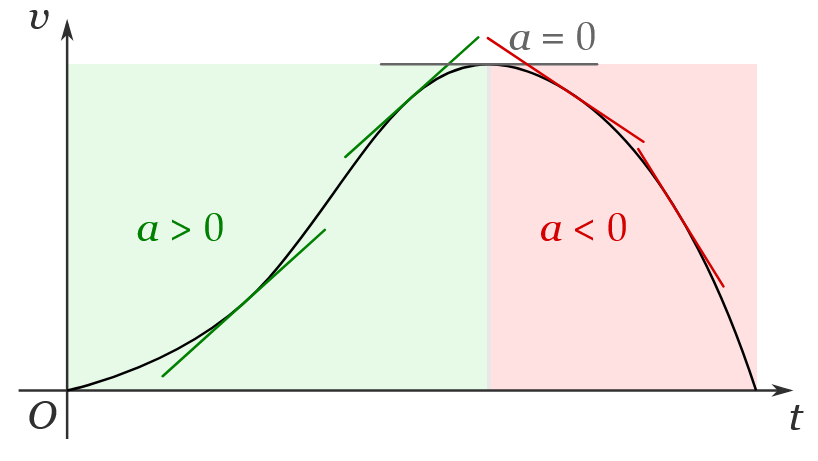
- Mathematically, it is defined as:
- \( a = \dfrac{dv}{dt} \)
- On a velocity–time (\(v\)-\(t\)) graph, the instantaneous acceleration equals the slope of the tangent line at the chosen point.
Interpretation:
- Steeper slope → greater acceleration.
- Positive slope → speeding up in the positive direction.
- Negative slope → slowing down or speeding up in the opposite direction.
- Zero slope → constant velocity (no acceleration).
This differs from average acceleration, which is the slope of the secant line between two points on the graph.
Example:
A bike’s velocity is given by \( v(t) = 4t^2 \) (m/s, seconds). Find the instantaneous acceleration at \( t = 3 \, \text{s} \).
▶️Answer/Explanation
Step (1): Instantaneous acceleration is derivative → \( a = \dfrac{dv}{dt} \).
Step (2): \( a = \dfrac{d}{dt}(4t^2) = 8t \).
Step (3): At \( t = 3 \), \( a = 8(3) = 24 \, \text{m/s}^2 \).
Final Answer: The bike’s instantaneous acceleration at \( 3 \, \text{s} \) is 24 m/s².
Displacement from Velocity–Time Graph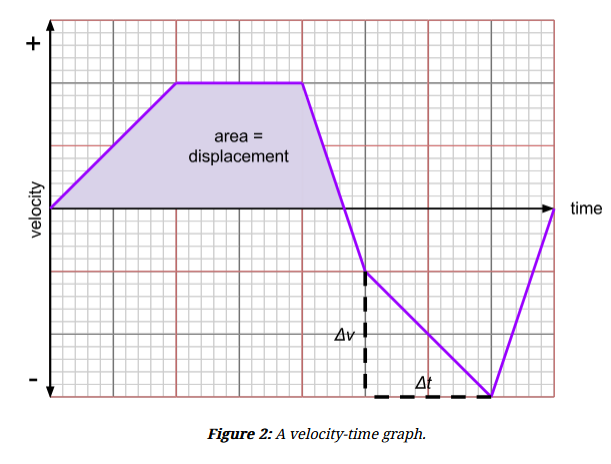
The displacement of an object in a given time interval can be determined from the area under the curve of its velocity–time (\(v\)-\(t\)) graph.
- Mathematically:
- \( \Delta x = \int_{t_1}^{t_2} v(t) \, dt \)
Interpretation:
- For constant velocity → displacement = rectangle area.
- For constant acceleration → displacement = area of a trapezium (or triangle + rectangle).
- If velocity is negative (below time axis), the area is negative → displacement is in the opposite direction.
- Total displacement = (positive areas) – (negative areas).
Note: Displacement ≠ Distance. Distance is the total area without considering sign, while displacement takes direction into account.
Example :
A car moves with a constant velocity of \( 12 \, \text{m/s} \) for \( 5 \, \text{s} \). Find its displacement.
▶️Answer/Explanation
Step (1): Displacement = area under \(v\)-\(t\) graph.
Step (2): Rectangle area = base × height = \( (5)(12) = 60 \, \text{m} \).
Final Answer: Displacement = 60 m.
Example :
A bike accelerates uniformly from rest to \( 20 \, \text{m/s} \) in \( 4 \, \text{s} \). Find the displacement in this time.
▶️Answer/Explanation
Step (1): Velocity–time graph is a straight line from (0,0) to (4,20).
Step (2): Displacement = area of triangle under graph.
Step (3): Area = \( \tfrac{1}{2} \times \text{base} \times \text{height} \).
Step (4): Area = \( \tfrac{1}{2}(4)(20) = 40 \, \text{m} \).
Final Answer: Displacement = 40 m.
Change in Velocity from Acceleration–Time Graph
The change in velocity (\( \Delta v \)) of an object in a time interval can be determined from the area under the curve of its acceleration–time (\(a\)-\(t\)) graph.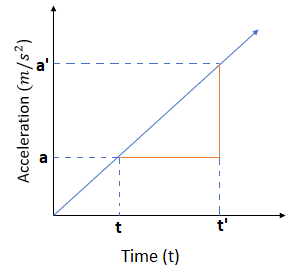
- Mathematically:
- \( \Delta v = \int_{t_1}^{t_2} a(t) \, dt \)
Interpretation:
- For constant acceleration → \( \Delta v = a \times \Delta t \).
- For variable acceleration → total change = sum of all geometric areas under the curve.
- If acceleration is negative (below the time axis), the area is negative → velocity decreases.
- The final velocity is given by: \( v = v_0 + \Delta v \).
Example:
A car accelerates at \( 3 \, \text{m/s}^2 \) for \( 6 \, \text{s} \). Find the change in velocity.
▶️Answer/Explanation
Step (1): Change in velocity = area under \(a\)-\(t\) graph = rectangle area.
Step (2): Area = base × height = \( (6)(3) = 18 \, \text{m/s} \).
Final Answer: \( \Delta v = 18 \, \text{m/s} \).
Example :
A bike accelerates at \( 4 \, \text{m/s}^2 \) for \( 2 \, \text{s} \), then decelerates at \( -2 \, \text{m/s}^2 \) for the next \( 3 \, \text{s} \). Find the net change in velocity.
▶️Answer/Explanation
Step (1): First interval → \( \Delta v_1 = (2)(4) = 8 \, \text{m/s} \).
Step (2): Second interval → \( \Delta v_2 = (3)(-2) = -6 \, \text{m/s} \).
Step (3): Net change = \( \Delta v_1 + \Delta v_2 = 8 – 6 = 2 \, \text{m/s} \).
Final Answer: Net change in velocity = 2 m/s.