Properties of an Ideal Gas
An ideal gas is a theoretical model of a gas whose behavior can be described by simple assumptions. It helps to explain the macroscopic properties of gases using microscopic motion of atoms and molecules.
Key Properties:
- The gas consists of a very large number of identical molecules.
- The molecules are in constant random motion.
- The volume of each molecule is negligible compared to the volume occupied by the gas.
- There are no intermolecular forces except during collisions.
- Collisions between molecules (and with container walls) are perfectly elastic → no loss of kinetic energy.
- The average kinetic energy of molecules depends only on the absolute temperature (T).
Equation of State (Ideal Gas Law):
\( PV = nRT \)
- \( P \): Pressure of the gas
- \( V \): Volume of the gas
- \( n \): Number of moles
- \( R \): Universal gas constant \( (8.314 \, J \, mol^{-1} K^{-1}) \)
- \( T \): Absolute temperature in Kelvin
Microscopic Form:
\( PV = N k_B T \)
- \( N \): Number of molecules
- \( k_B \): Boltzmann constant \( = 1.38 \times 10^{-23} \, J/K \)
Implications of Ideal Gas Behavior:
- Pressure arises from molecular collisions with container walls.
- At a given temperature, different gases have the same average kinetic energy per molecule.
- Real gases behave like ideal gases at low pressure and high temperature.
Example :
A 2 mol ideal gas is kept at 300 K in a 5 L container. Find the pressure.
▶️ Answer/Explanation
\( PV = nRT \)
\( P = \dfrac{nRT}{V} \)
\( = \dfrac{(2)(8.314)(300)}{0.005} \)
\( = 9.98 \times 10^{5} \, Pa \)
Answer: Pressure ≈ \( 1.0 \times 10^{6} \, Pa \).
Example :
Find the average kinetic energy of one molecule of an ideal gas at \( T = 400 \, K \).
▶️ Answer/Explanation
\( \overline{KE} = \dfrac{3}{2} k_B T \)
\( = \dfrac{3}{2} (1.38 \times 10^{-23})(400) \)
\( = 8.28 \times 10^{-21} \, J \)
Answer: Average KE per molecule ≈ \( 8.3 \times 10^{-21} \, J \).
Example :
A gas sample has \( N = 3 \times 10^{23} \) molecules at 1 atm pressure and 300 K. Find the volume.
▶️ Answer/Explanation
\( PV = N k_B T \)
\( V = \dfrac{N k_B T}{P} \)
\( = \dfrac{(3 \times 10^{23})(1.38 \times 10^{-23})(300)}{1.01 \times 10^{5}} \)
\( = \dfrac{12.42}{1.01 \times 10^{5}} \)
\( \approx 1.23 \times 10^{-4} \, m^3 \)
Answer: Volume ≈ \( 1.23 \times 10^{-4} \, m^3 \) (or 0.123 L).
Graphs and Gas Laws
Graphs Relating P, V, and T:
Gas laws describe the relationship between pressure (P), volume (V), and temperature (T). These relationships can be visualized and analyzed using graphs:
| Gas Law | Equation | Constant Condition | Graph |
|---|---|---|---|
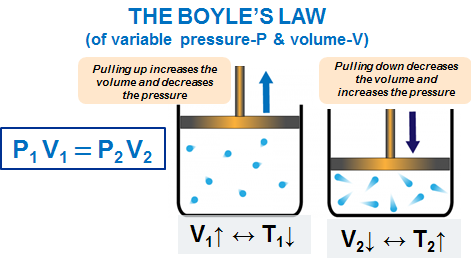
Boyle’s Law | \( PV = \text{constant} \) | Temperature (T) constant |
P vs V → Hyperbola |
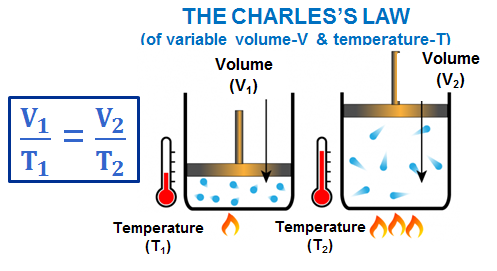
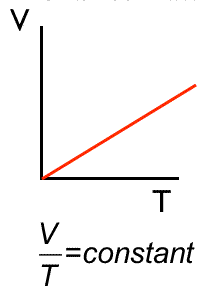
Charles’ Law | \( V \propto T \) | Pressure (P) constant |
V vs T → Straight Line |
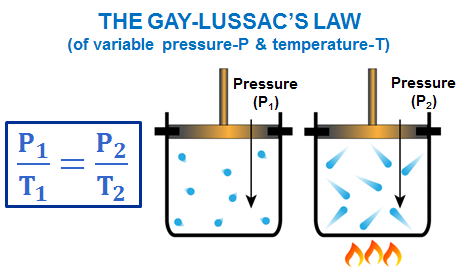
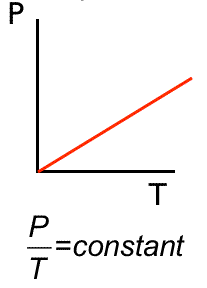
Gay-Lussac’s Law | \( P \propto T \) | Volume (V) constant |
P vs T → Straight Line |

These graphs can be used to determine properties such as pressure at a given T, volume changes, or even to verify ideal gas behavior.
Extrapolation to Absolute Zero:
If the pressure of a fixed-volume gas is plotted against temperature (in °C), the line is straight.

- Extrapolating the line backward shows the pressure would become zero at a certain temperature.
- This temperature is called absolute zero (\( 0 \, K = -273.15^\circ C \)).
- Significance: Absolute zero is the lowest possible temperature, where particles would have minimum kinetic energy.
Example:
A gas at constant volume has pressures 1.0 × 10⁵ Pa at 0°C and 1.5 × 10⁵ Pa at 100°C. Estimate the temperature at which pressure becomes zero.
▶️ Answer/Explanation
Relation: \( \dfrac{P}{T(K)} = \text{constant} \).
Slope of P vs. T line: \( \dfrac{1.5 \times 10^5 – 1.0 \times 10^5}{100 – 0} = 500 \, Pa/°C \).
Extrapolate: \( T = \dfrac{-1.0 \times 10^5}{500} = -200^\circ C \) (approx).
Answer: Zero pressure at ≈ -200°C (real absolute zero is -273°C, deviation due to experimental data).
Example :
A gas has a volume of 2.0 L at 0°C and 2.73 L at 100°C, at constant pressure. Use a V–T graph to determine the temperature where volume would be zero.
▶️ Answer/Explanation
Graph shows straight-line relation: \( V \propto T \).
Slope: \( \dfrac{2.73 – 2.0}{100 – 0} = 0.0073 \, L/°C \).
Extrapolate: \( 0 = 2.0 + (0.0073)(T) \).
\( T = -273^\circ C \).
Answer: Extrapolated zero volume at ≈ -273°C → consistent with absolute zero.