Question

Two wave pulses approach each other, as shown in the figure above. The pulse traveling to the right is half the height and twice the width of the pulse traveling to the left. Which of the following best represents the resulting shape when the peaks of the two pulses are at the same location?

Answer/Explanation
Ans:D
Questions The graph below was produced by a microphone in front of a tuning fork. It shows the voltage produced from the microphone as a function of time.
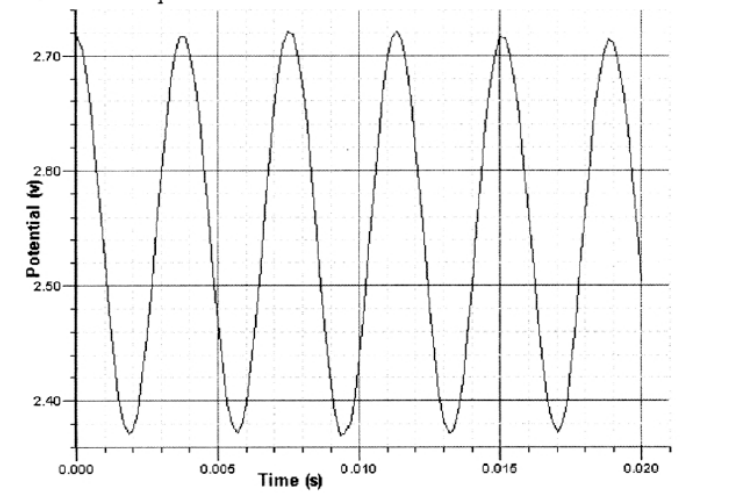
Question(a)
The frequency of the tuning fork is (approximately)
A) 0.004 s B) 0.020 s C) 50Hz D) 250 Hz
Answer/Explanation
Ans: D
Solution: f = cycles / seconds