
AP Physics 2- 11.2 Simple Circuits- Exam Style questions - FRQs- New Syllabus
Simple Circuits AP Physics 2 FRQ
Unit 11: Electric Circuits
Weightage : 15–18%
Question

| \(\Delta V\ \left(\text{V}\right)\) | \(6.0\) | \(5.0\) | \(3.5\) | \(2.5\) | \(2.0\) | \(1.5\) |
| \(I\ \left(\text{A}\right)\) | \(0.078\) | \(0.070\) | \(0.044\) | \(0.036\) | \(0.027\) | \(0.018\) |
Most-appropriate topic codes (AP Physics 2):
• Topic \(11.2\) — Simple Circuits (Part \( \mathrm{(a)} \), Part \( \mathrm{(c)(i)} \))
▶️ Answer/Explanation
(a)(i)
Connect the power supply, ammeter, and one conducting rod in series. Connect the voltmeter in parallel across the rod so that it measures the potential difference across only the rod.
Use the metric ruler to measure the length \(L\) of the rod and the diameter \(d\) of the cylindrical rod. The cross-sectional area is \(A=\pi\left(\dfrac{d}{2}\right)^2\).
Turn on the power supply and record the current \(I\) through the rod and the potential difference \(\Delta V\) across the rod. Repeat for several rods with different lengths and diameters, or repeat using one rod with several different values of \(\Delta V\) to confirm that the rod is ohmic.
For each trial, calculate the resistance of the rod using \(R=\dfrac{\Delta V}{I}\). Keep the current small or take measurements quickly so that heating of the rod is minimized.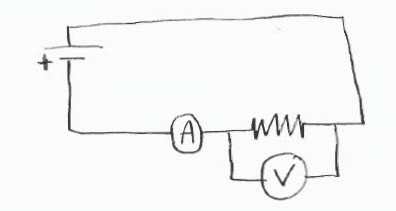
(a)(ii)
For a cylindrical rod, \(R=\dfrac{\rho L}{A}\), where \(\rho\) is the resistivity of the material.
Rearranging gives \(R=\rho\left(\dfrac{L}{A}\right)\). Therefore, graph \(R\) on the vertical axis and \(L/A\) on the horizontal axis.
The slope of this graph is the resistivity:
\(\text{slope}=\dfrac{R}{L/A}=\rho\)
\(\boxed{\rho=\text{slope of a graph of }R\text{ versus }L/A}\)
An equivalent method is to graph \(\Delta V/I\) or measured resistance values against \(L/A\).
(b)
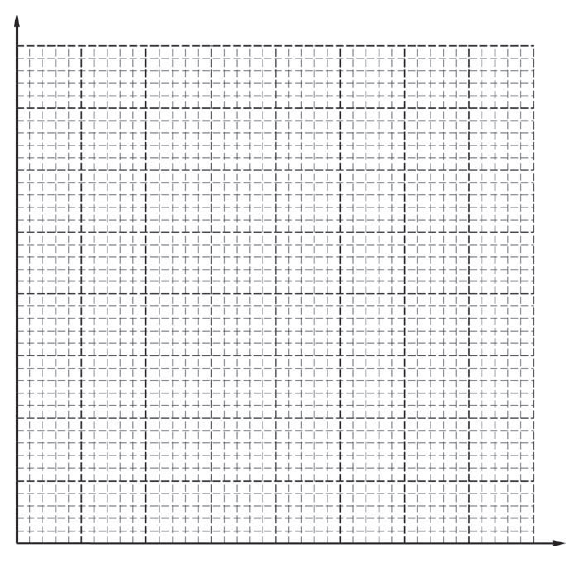
To determine the resistance of the rectangular rod, plot \(\Delta V\) on the vertical axis and \(I\) on the horizontal axis. For an ohmic conductor, \(\Delta V=IR\), so the slope of a \(\Delta V\) versus \(I\) graph is the resistance \(R\).
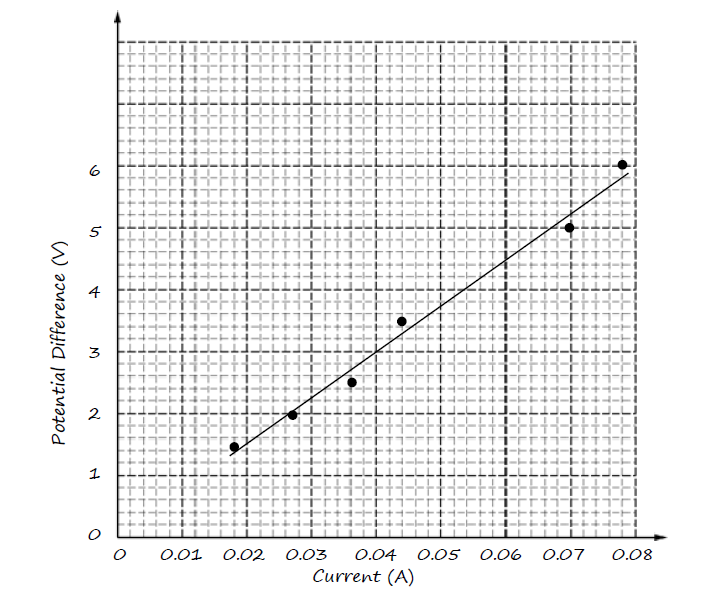
Using two points on a reasonable best-fit line, for example \(\left(0.032\,\text{A},2.4\,\text{V}\right)\) and \(\left(0.078\,\text{A},5.8\,\text{V}\right)\):
\(R=\text{slope}=\dfrac{\Delta V_2-\Delta V_1}{I_2-I_1}\)
\(R=\dfrac{5.8\,\text{V}-2.4\,\text{V}}{0.078\,\text{A}-0.032\,\text{A}}\)
\(R=\dfrac{3.4\,\text{V}}{0.046\,\text{A}}\)
\(R=73.9\,\Omega\)
\(\boxed{R\approx 74\,\Omega}\)
An acceptable value from a reasonable best-fit line is approximately \(70\,\Omega\) to \(79\,\Omega\).
(c)(i)
The internal resistance of the power supply will not affect the value of the resistance of the rectangular rod if the students measure \(\Delta V\) directly across the rod.
The rod’s resistance is found from \(R=\dfrac{\Delta V_{\text{rod}}}{I}\). Since \(\Delta V_{\text{rod}}\) is measured across the rod itself, any voltage lost inside the power supply is not included in \(\Delta V_{\text{rod}}\).
\(\boxed{\text{The calculated rod resistance is not affected if the voltmeter measures only across the rod.}}\)
(c)(ii)
The students should be concerned if the rods heat up significantly because the resistivity of a conductor typically changes with temperature.
If the temperature of the rod increases, then the resistivity \(\rho\) and resistance \(R\) may change during the measurements. This would make the calculated resistivity less reliable.
However, if the temperature change is very small compared with other experimental uncertainties, then the effect may be negligible.
\(\boxed{\text{A temperature change can change }R\text{ and }\rho\text{, so it should be considered if heating is noticeable.}}\)