AP Physics 2- 9.5 Specific Heat and Thermal Conductivity- Exam Style questions - FRQs- New Syllabus
Specific Heat and Thermal Conductivity AP Physics 2 FRQ
Unit 9: Thermodynamics
Weightage : 15–18%
Question


| \( T_G \) \( (\mathrm{K}) \) | \( T_L \) \( (\mathrm{K}) \) | \( \dfrac{Q}{\Delta t} \) \( \left(\dfrac{\mathrm{J}}{\mathrm{s}}\right) \) |
|---|---|---|
| \( 295 \) | \( 295 \) | \( 0.0 \) |
| \( 371 \) | \( 303 \) | \( 26.3 \) |
| \( 425 \) | \( 308 \) | \( 43.1 \) |
| \( 475 \) | \( 313 \) | \( 60.0 \) |
| \( 528 \) | \( 323 \) | \( 75.0 \) |

Most-appropriate topic codes (AP Physics 2):
• Topic \( 9.3 \) — Thermal Energy Transfer and Equilibrium (Part \( \mathrm{(a)} \), Part \( \mathrm{(b)} \))
• Topic \( 9.4 \) — The First Law of Thermodynamics (Part \( \mathrm{(b)} \))
• Topic \( 9.5 \) — Specific Heat and Thermal Conductivity (Part \( \mathrm{(c)} \), Part \( \mathrm{(d)} \))
▶️ Answer/Explanation
(a)
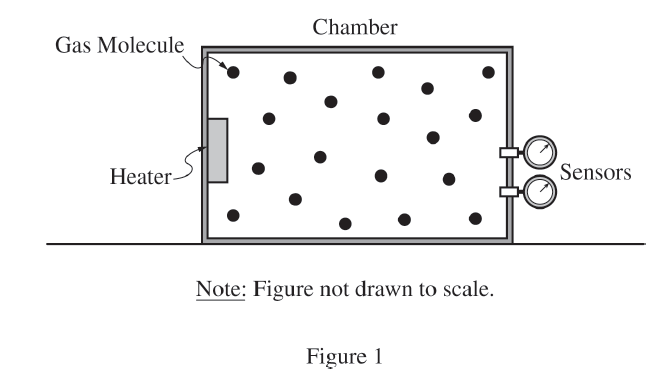
First measure the chamber dimensions to determine the gas volume \( V \). Since the chamber has rigid walls, the volume remains constant throughout the experiment.
Then turn on the heater and use the temperature and pressure sensors to record pairs of values \( (T, P) \) at many times during the heating process. For example, record the temperature and pressure every \( 10\ \mathrm{s} \) over a suitable time interval.
To reduce uncertainty, take many pressure-temperature data pairs over a wide range of temperatures, repeat the entire heating trial if possible, and average repeated readings. Also allow the sensor readings to stabilize before recording values.
Because the volume is known and fixed, the collected \( P \) and \( T \) data can be used with the ideal gas law to determine \( N \).
(b)(i)
On a \( P \)-versus-\( V \) graph, the process is a vertical line upward.
The chamber walls are rigid, so the gas volume stays constant while the heater increases the gas temperature. As temperature rises at constant volume, pressure increases, so the arrow points upward.

(b)(ii)
On a \( U \)-versus-\( V \) graph, the process is also a vertical line upward.
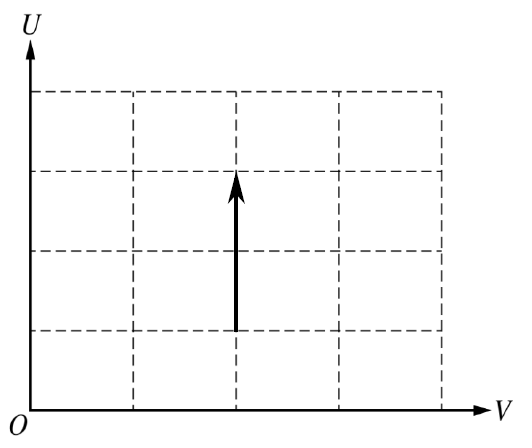
(b)(iii)
The volume remains constant because the chamber is rigid, so the graph must stay at one value of \( V \). While the heater is on, energy is transferred into the gas, so the internal energy \( U \) increases. Therefore the line is vertical and points upward.
For an ideal gas, internal energy depends only on temperature, and heating the gas increases its temperature.
(c)(i)
A correct linear graph is:
Vertical Axis: \( \dfrac{Q}{\Delta t} \) \( \left(\dfrac{\mathrm{J}}{\mathrm{s}}\right) \)
Horizontal Axis: \( \Delta T = T_G – T_L \) \( (\mathrm{K}) \)
because thermal conduction satisfies
\( \dfrac{Q}{\Delta t} = \dfrac{kA}{L}\Delta T \)
which is a straight-line relationship of the form \( y=mx \).
The calculated values of \( \Delta T \) are:
| \( T_G \) \( (\mathrm{K}) \) | \( T_L \) \( (\mathrm{K}) \) | \( \dfrac{Q}{\Delta t} \) \( \left(\dfrac{\mathrm{J}}{\mathrm{s}}\right) \) | \( \Delta T=T_G-T_L \) \( (\mathrm{K}) \) |
|---|---|---|---|
| \( 295 \) | \( 295 \) | \( 0.0 \) | \( 0 \) |
| \( 371 \) | \( 303 \) | \( 26.3 \) | \( 68 \) |
| \( 425 \) | \( 308 \) | \( 43.1 \) | \( 117 \) |
| \( 475 \) | \( 313 \) | \( 60.0 \) | \( 162 \) |
| \( 528 \) | \( 323 \) | \( 75.0 \) | \( 205 \) |
(c)(ii)
A correct graph of \( \dfrac{Q}{\Delta t} \) versus \( \Delta T \) is shown below.

(c)(iii)
Draw a straight best-fit line through the plotted points. The data are approximately linear because conductive heat transfer is proportional to temperature difference.
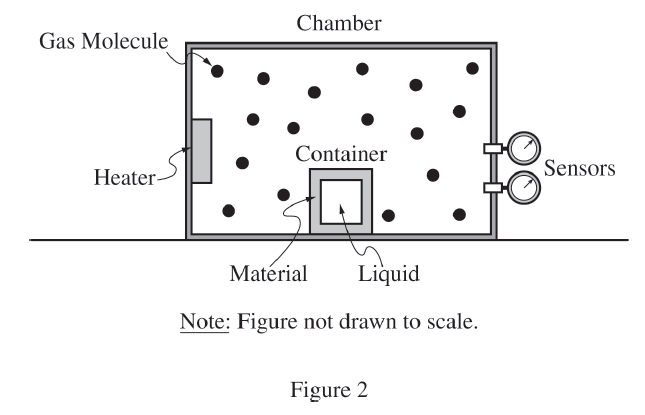
(d)
For conduction through a uniform material,
\( \dfrac{Q}{\Delta t} = \dfrac{kA}{L}\Delta T \)
Therefore, on a graph of \( \dfrac{Q}{\Delta t} \) versus \( \Delta T \), the slope is
\( \text{slope}=\dfrac{kA}{L} \)
Using two convenient points from the best-fit line, approximately \( (120\ \mathrm{K},\,44\ \mathrm{J/s}) \) and \( (220\ \mathrm{K},\,80\ \mathrm{J/s}) \):
\( \text{slope}=\dfrac{80-44}{220-120} = \dfrac{36}{100} = 0.36\ \dfrac{\mathrm{J}}{\mathrm{s\cdot K}} \)
Now solve for \( k \):
\( k=\dfrac{L}{A}(\text{slope}) \)
\( k=\dfrac{0.01\ \mathrm{m}}{0.06\ \mathrm{m^2}}\left(0.36\ \dfrac{\mathrm{J}}{\mathrm{s\cdot K}}\right) \)
\( k=0.060\ \dfrac{\mathrm{J}}{\mathrm{s\cdot K\cdot m}} \)
So the experimental value is
\( \boxed{k \approx 0.06\ \dfrac{\mathrm{J}}{\mathrm{s\cdot K\cdot m}}} \)