Question
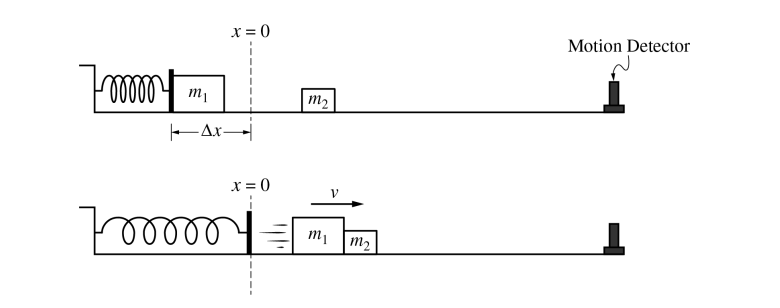
Block 1 of mass \(m_{1}\) is held at rest while compressing an ideal spring an amount Δx. The spring constant of the spring is k . Block 2 has mass \(m_{2}\), where \(m_{2}\), where \(m_{2}\) > \(m_{1}\). At time t = 0, Block 1 is released. At time \(t_{C}\), the spring is no longer compressed and Block 1 immediately collides with and sticks to Block 2. The blocks stick together and the two-block system moves with constant speed v, as shown. Frictional effects are negligible.
(a) The impulse on Block 1 from the spring during the time interval 0 < t < \(t_{C}\) is \(J_{S}\). The impulse on Block 1 from Block 2 during the collision is \(J_{2}\). Which of the following expressions correctly compares the magnitudes of \(J_{S}\)and \(J_{2}\) ?
___\(J_{S}\) > \(J_{2}\) ___\(J_{S}\) < \(J_{2}\) ___ \(J_{S}\) = \(J_{2}\)
Justify your answer
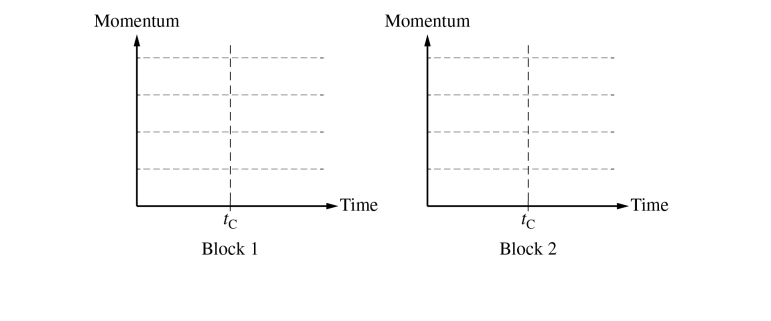
(b) On the following axes, draw graphs of the magnitude of the momentum of each block as a function of time, before and after \(t_{C}\). The collision occurs in a negligible amount of time. The grid lines on each graph are drawn to the same scale.
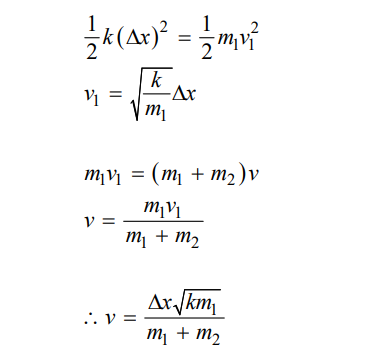
(c)Show that the velocity v of the two-block system after the collision is given by the equation \(v = \frac{\sqrt{km_{1}}}{m_{1}+ m_{2}}\Delta x\)
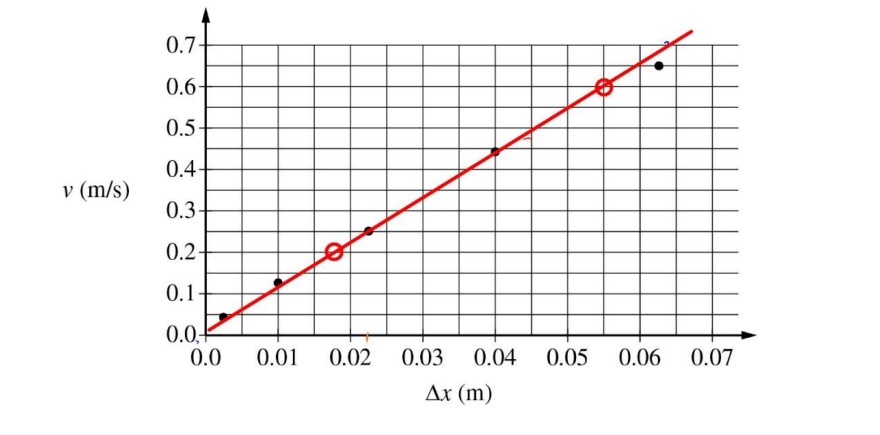
(d) A group of students use the setup to perform an experiment. They measure the mass of Block 1 to be \(m_{1}\)= 0 .500 kg, and the spring constant k of the spring to be 150 N/m. The mass of Block 2 is unknown. They perform several trials and in each trial the spring is compressed a different distance ∆x and the final velocity v of the two-block system is measured. They graph v as a function of ∆x, as shown below.
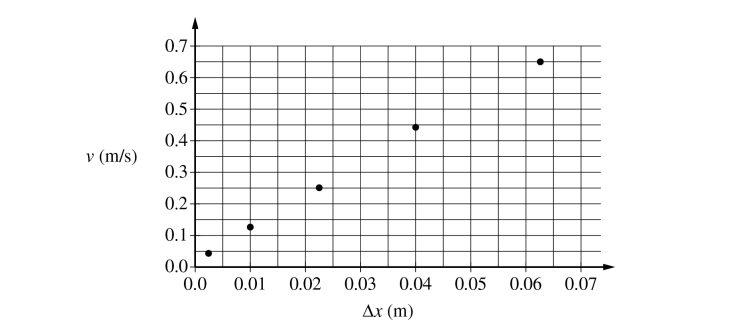
i. Draw a line that represents the best fit to the data points shown.
ii. Use the best-fit line to calculate the mass of Block 2.
(e) After the experiment, the students use a balance to measure the mass of Block 2 and find it to be greater than what was determined in part (d). To explain this discrepancy, one of the students proposes that the spring constant was incorrectly measured at the beginning of the experiment. The students measure the spring constant again and record a new value, k′.
Should the students expect that k′ be greater than 150 N / m, less than 150 N / m, or equal to 150 N / m ?
_____k′ > 150 N / m _____k′ < 150 N / m _____ k′ = 150 N / m
Justify your answer.
▶️Answer/Explanation
2(a) Example Response
The impulse between the two blocks is the same, so because Block 1 is moving at the end, the impulse given by the spring must be greater than the impulse given to Block 2 by Block 1.
2(b) Example Response
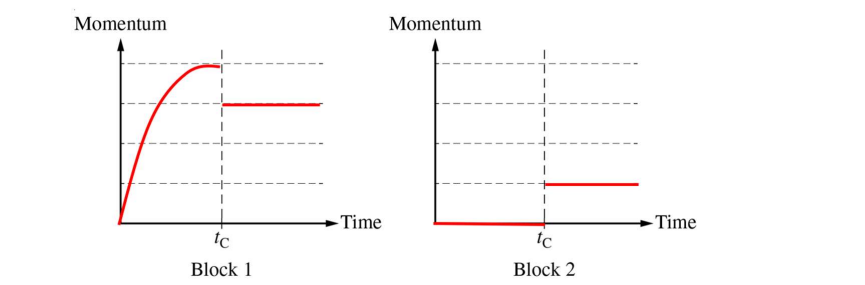
2(c) Example Response
2(d)(i) Example Response
2(d)(ii) Example Response
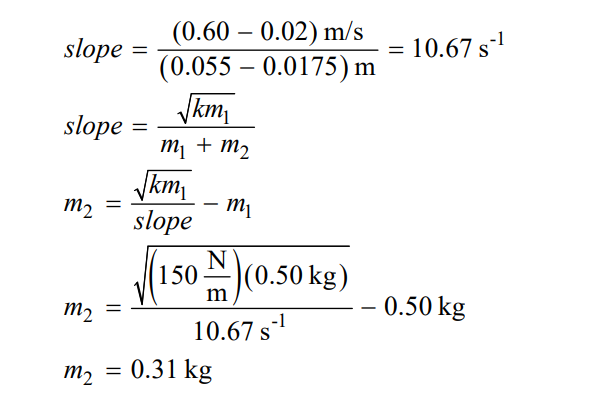
Scoring Note: Acceptable responses for mass are 0.27 kg – 0.37 kg.
2(e) Example Response
A greater \(m_{2}\) indicates the spring constant k′ should be greater than 150 N/m . The slope of the graph is the same so as \(m_{2}\) increases k must be smaller.
Question

1. Blocks A and B of masses 2m and m, respectively, are arranged in a setup consisting of a ramp that makes an angle q with a smooth horizontal table and an ideal spring of spring constant k fixed to a wall, as shown. Block A is held at rest a distance D up the ramp, and Block B is at rest on the horizontal table. The coefficient of kinetic friction between Block A and the rough ramp is \(\mu \) in the region of length D, and there is negligible friction between the blocks and the smooth table.
At time t = 0, Block A is located at horizontal position x = 0 and is released from rest. After the block is released, the following occurs.
- At time t =\( t_{1}\) , Block A has traveled a distance D down the ramp, has transitioned to the table, and is moving with speed v at x = \(x_{1}\) .
- At time t = \(t_{2} \), Block A is at x = \(x_{2} \) when it collides with and sticks to Block B.
- At time t = \(t_{3} \), the combined blocks A and B are at x = \(x_{3} \) when they collide with and stick to the spring in its equilibrium position.
- At time t = \(t_{4} \), the combined blocks A and B are instantaneously at rest and the spring is compressed a distance \(x_{c} \) from its equilibrium position.
(a) For parts (a)(i) and (a)(ii), express your answer in terms of m, \(\Theta \), D, \(\mu \), \(x_{c}\), and physical constants, as appropriate.
i. Derive an expression for the speed v of Block A at time \(t_{1} \)
ii. Derive an expression for the spring constant k of the spring.

(b)
i. On the following axes, sketch a graph of the magnitude of the momentum \(p_{A} \) of Block A as a function of time t from t = 0 to \(t_{4} \).

ii. Use principles of forces to justify the graph drawn in part (b)(i) for the time interval t t = \(t_{3} \) to t = \(t_{4} \). Explicitly reference features of the shape of the graph you drew in part (b)(i).
For times t > \(t_{4} \), the two-block-spring system oscillates with period \(T_{O} \). The procedure is then repeated using a new ramp, where there is negligible friction between Block A and the ramp.
(c) Indicate how the new period of oscillation \(T_{N} \) in the procedure that uses the new ramp compares with the period of oscillation \(T_{O} \) from the original procedure.
_____ \(T_{N} \) > \(T_{O} \). _____ \(T_{N} \) < \(T_{O} \) _____ \(T_{N} \) = \(T_{O} \)
Briefly justify your answer.
▶️Answer/Explanation
1(a)(i)Example Solution

1(a)(ii)Example Solution

1(b)(i)Example Response

1(b)(ii)Example Response
The momentum of Block A decreases between \(t_{3} \) and \(t_{4} \) because the spring exerts a force on the blocks in the opposite direction of the velocity of the blocks, causing the blocks to slow to a stop. The spring force increases the more the spring compresses, so the momentum of Block A decreases at an increasing rate, which is shown in the slope of the curve becoming steeper with time.
1(c)Example Response
Repeating the experiment on a smooth ramp will only affect the compression distance of the spring. The period of oscillation of a spring-block system depends only on mass and the spring constant, therefore the period of oscillation will not change.
Question
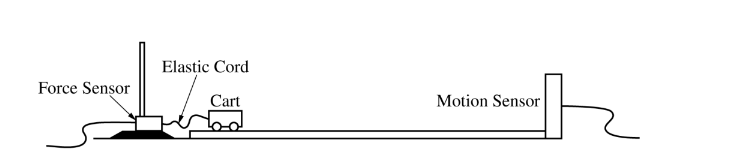
A student sets up an experiment with a cart on a level horizontal track. The cart is attached with an elastic cord to a force sensor that is fixed in place on the left end of the track. A motion sensor is at the right end of the track, as shown in the figure above. The cart is given an initial speed of v0 = 2.0 m s and moves with this constant speed until the elastic cord exerts a force on the cart. The motion of the cart is measured with the motion detector, and the force the elastic cord exerts on the cart is measured with the force sensor. Both sensors are set up so that the positive direction is to the left. The data recorded by both sensors are shown in the graphs of velocity as a function of time and force as a function of time below.
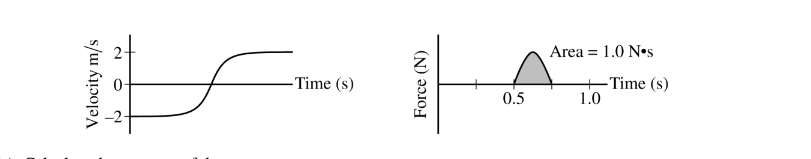
(a) Calculate the mass m of the cart. For time period from 0.50 s to 0.75 s, the force F the elastic cord exerts on the cart is given as a function of time t by the equation F A = sin(ωt) , where A = 6.3 N and ω = 12.6 rad/s.
(b) Using the given equation, show that the area under the graph above is 1.0 N .s
(c) The experiment is repeated using a different cord that exerts a larger average force on the cart. The cart starts and ends with the same speeds as those in the original experiment. Will the area for the graph of force as a function of time for the new cord be greater than, less than, or equal to the area for that of the original cord? ____ Greater than ____ Less than ____ Equal to Justify your answer. The elastic cord from the original experiment can be modeled as an ideal spring with force constant k .
(d) Derive an expression for the maximum change in length \(x_{MAX}\) for the cord. Express your answer in terms of m, k, \(v_0\) , and physical constants, as appropriate.
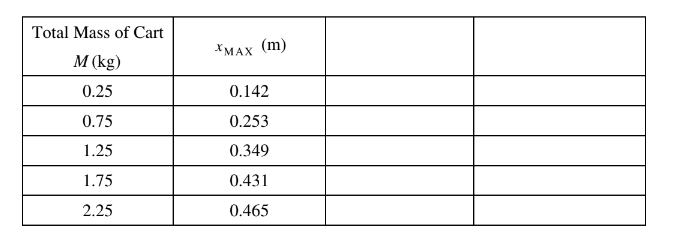
The student performs several trials of the experiment. For the first trial, the cart is empty. In each succeeding trial, a block is added to the cart. In all trials, the cart has an initial speed of 2.0 m s to the right, the cart rebounds to the left with a speed of 2.0 m s , and the maximum change in length of the elastic cord is measured. The total mass M of the cart and the maximum change in length of the cord in each trial are recorded in the table below.
(e) Indicate below which quantities should be graphed to yield a straight line with a slope that could be used to calculate a numerical value for the force constant of the elastic cord k. Vertical axis:
Horizontal axis: Use the remaining columns in the table on the previous page, as needed, to record any quantities that you indicated that are not given.
(f) Plot the data points for the quantities indicated in part (e) on the graph below. Clearly scale and label all axes, including units as appropriate. Draw a straight line that best represents the data.
(g) Use the best-fit line to calculate the force constant k of the elastic cord.
Answer/Explanation
(a) For correctly using the area under the graph to calculate the mass of the cart j=Area = \(\Delta p=m(v_2-V_1)\) For a correct answer with units \(m=\frac{Area}{(v_2-v_1)}\)=\(\frac{(1.0N.s)}{(2.0m/s-(-2.0m/s))}\) m = 0.25 kg
(b) For relating the time integral of given equation to the area under the curve For applying the correct limits of integration
\(j=Area=\int_{0.50}^{0.75}Asin(\omega t)dt\)
\(j=-\frac{A}{\omega }[cos\omega t]_{0.50}^{0.75}=-\frac{(6.3N)}{(12.6rad/s)}[cos(12.6t)]_{0.50}^{0.75}\)
\(j=-(0.50)(cos[12.6(0.75)])-cos[(12.6)(0.50)]\)
\(j=1.0N.s\)
(c) For selecting “Equal to” with an attempt at a relevant justification For a correct justification Example: Since the cart starts and ends at the same velocity, the impulse on the cart will be the same so the area under the graph will be the same. Note: If the wrong selection is made, the justification is ignored.
(d) For correctly using conservation of energy
\(U_{MAX}=K_{MAX}\)
\(\frac{1}{2}kx^{2}_{MAX}=\frac{1}{2}mv_{0}v^2\)
\(x_{MAX}=v_{0}\sqrt{\frac{m}{k}}\)
(e) For correctly indicating two variables that will yield a straight line that could be used to determine a value for Example: Vertical Axis: \(x_{MAX}\) Horizontal Axis:\(\sqrt{m}\)
Note: Student earns full credit if axes are reversed or if they use another acceptable combination
(f) For a correct scale that uses more than half the grid 1 point For correctly labeling the axis with variables and units consistent with part (e) Note: Student earns full credit if axes are reversed
For correctly plotting data For drawing a straight line consistent with the plotted data
(g) For correctly calculating the slope from the best-fit line and not the data points
Example: \(slope=\frac{\Delta x_{MAX}}{\Delta \sqrt{m}}=\frac{(0.40-0.20)m}{(1.32-0.70)\sqrt{kg}}=0.34m/\sqrt{kg} 0.33m/\sqrt{kg}\)
\(\frac{v_{0}}{\sqrt{k}}\therefore k=\frac{v^2_{0}}{(slope)^2}=\frac{(2.0m/s)^2}{(0.34m/\sqrt{kg})^2}\) k=34.6N/m
(linear reression k=36.7N/m)