
AP Physics C Mechanics - 2.9 Resistive Forces- Exam Style questions- FRQs
Resistive Forces AP Physics C Mechanics FRQ
Unit 2: Force and Translational Dynamics
Weightage : 20-15%
Question
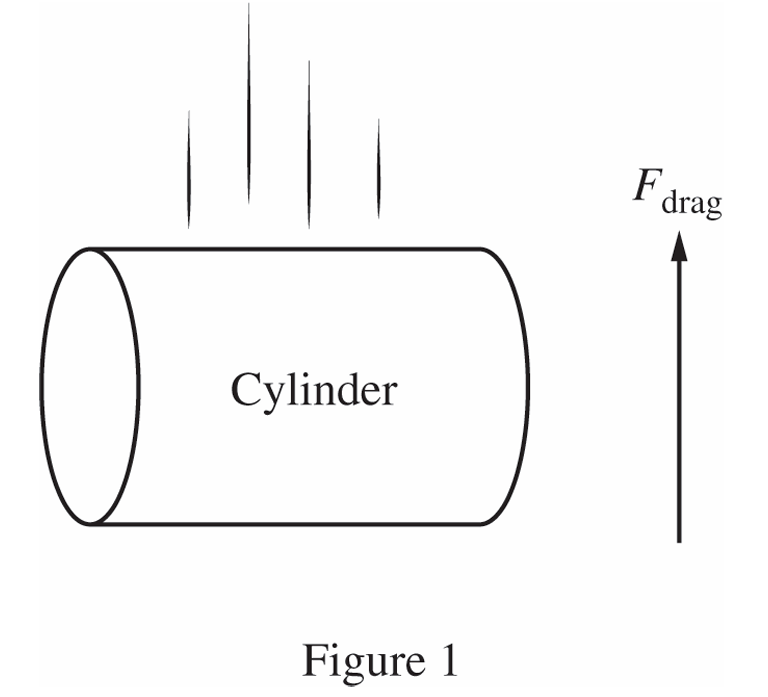
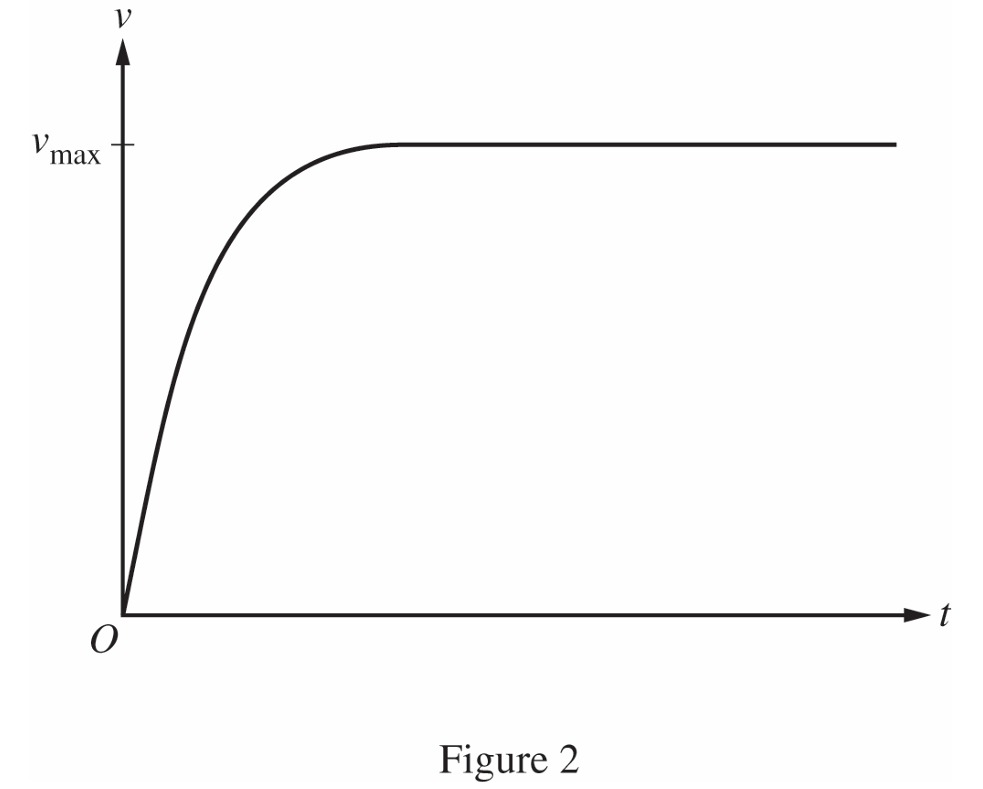
ii. Justify the location of \(t_{1}\). Explicitly reference appropriate features of the sketch in Figure \(2\).
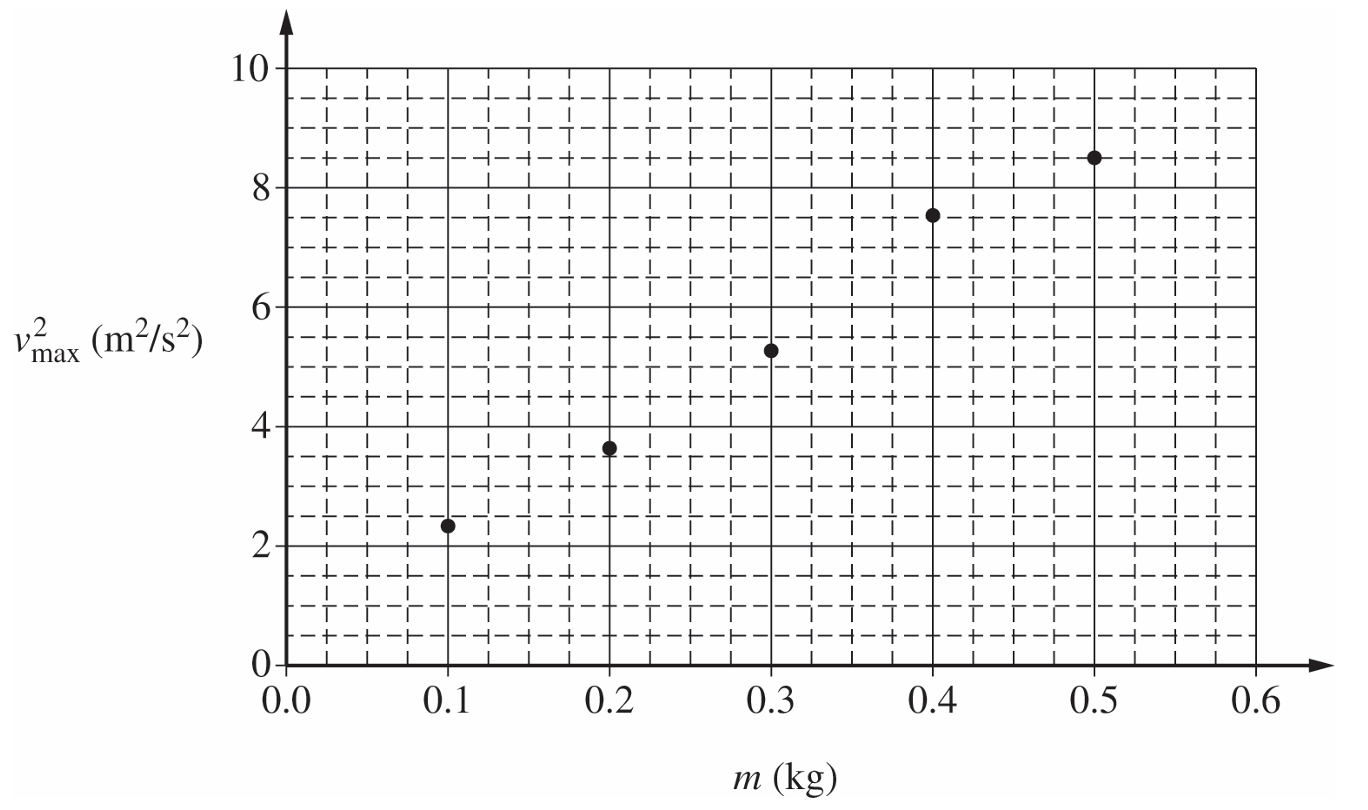
ii. Use the best-fit line to calculate an experimental value for \(b\).
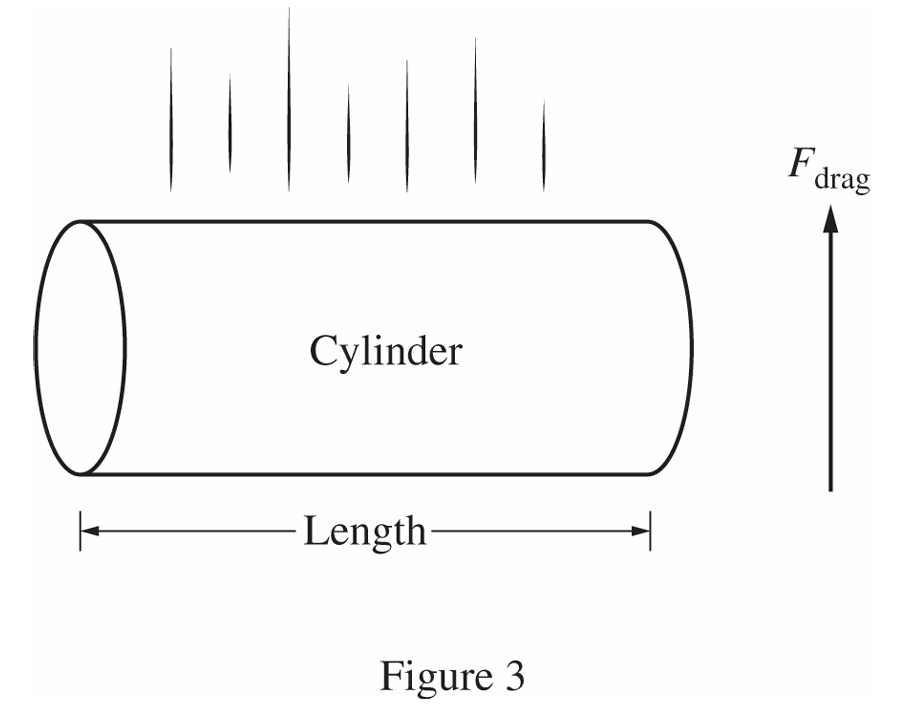
• Cylinder Set 2: cylinders of the same known mass with different known lengths
• A motion detector that can measure velocity as a function of time
Vertical axis: __________
Horizontal axis: __________
ii. Briefly describe how the quantities graphed could be used to determine the relationship between cylinder length and maximum speed.
Most-appropriate topic codes (AP Physics C: Mechanics):
• Topic \(2.5\) — Newton’s Second Law (Part \( \mathrm{a} \))
▶️ Answer/Explanation
(a)
To find the differential equation, we can start by writing out Newton’s second law for the cylinder falling downward. It’s acted upon by gravity pulling it down and a drag force resisting its motion upwards.
\( \Sigma F_y = ma_y \)
\( F_g – F_{\text{drag}} = ma_y \)
\( mg – bv^2 = m\dfrac{dv}{dt} \)
(b)(i)
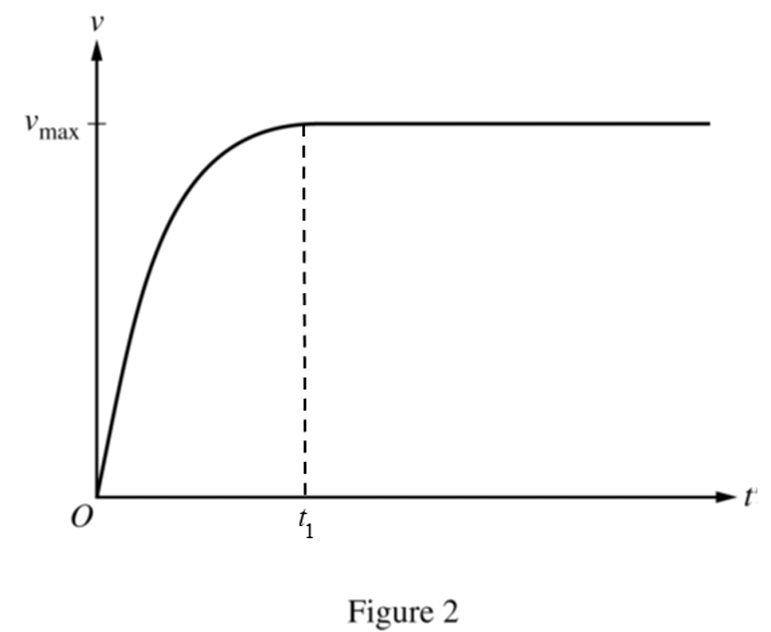
On Figure 2, draw a vertical dashed line down to the horizontal time axis originating exactly at the point where the curve turns completely horizontal. Label this specific time as \(t_1\).
(b)(ii)
Looking at the graph, the line becomes totally horizontal after \(t_1\), which means the velocity has stopped changing and is now constant. A constant velocity tells us that the cylinder’s acceleration has dropped to zero. For the acceleration to be zero, the net force must also be zero—meaning the upward drag force has grown large enough to perfectly balance the downward pull of gravity.
(c)
Correct answer: Equal to
If the student throws the cylinder straight up, it will eventually slow down, momentarily stop at its peak, and then begin falling. At that highest point, its speed is \(0\,\text{m/s}\), which is exactly the same starting condition as when it was dropped from rest. Since it reached \(v_{\text{max}}\) from the lower drop height, falling from an even higher peak guarantees it will have plenty of time to hit that same terminal velocity again.
(d)(i)
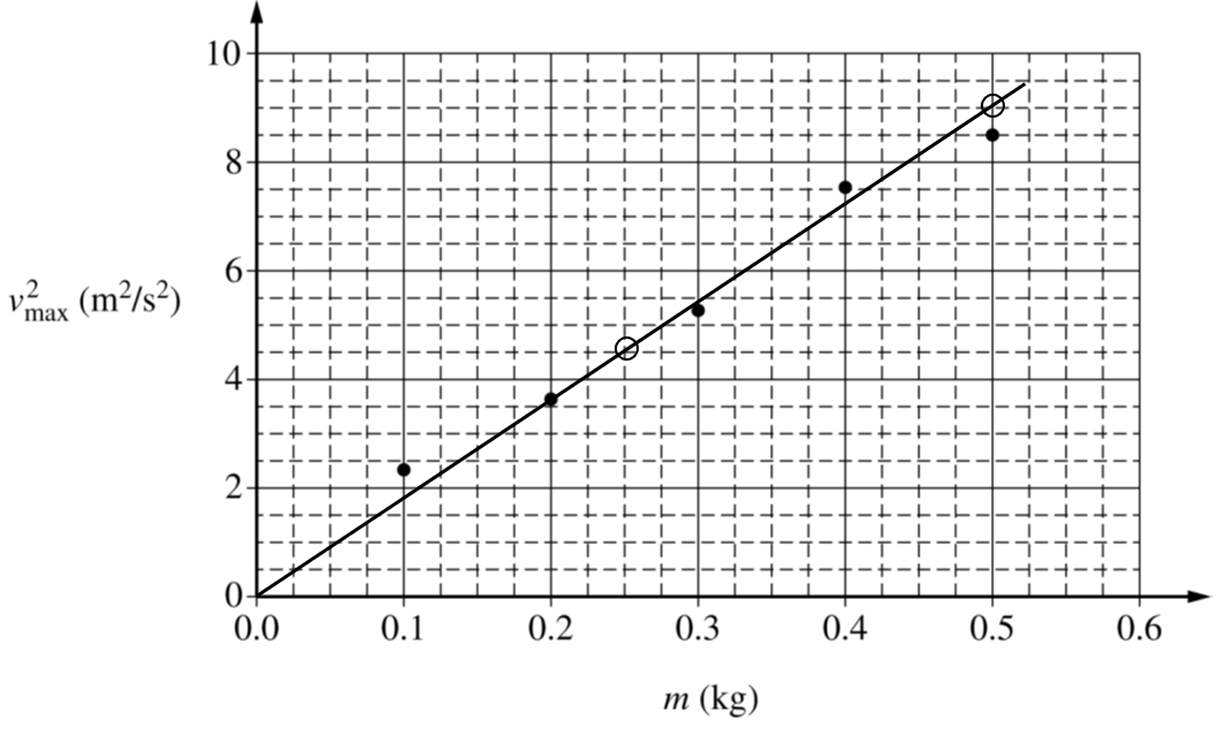
Draw a straight, linear line of best fit through the data points on the \(v_{\text{max}}^2\) versus \(m\) graph, trying to keep an equal balance of points above and below your line.
(d)(ii)
To get an experimental value for \(b\), let’s calculate the slope of the best-fit line using two points that lie directly on the line. Let’s use \((0.25\,\text{kg}, 4.5\,\text{m}^2/\text{s}^2)\) and \((0.50\,\text{kg}, 9.0\,\text{m}^2/\text{s}^2)\) as an example:
\( \text{Slope} = \dfrac{9.0 – 4.5}{0.50 – 0.25} = 18\,\text{m}^2/(\text{s}^2\cdot\text{kg}) \)
Since the cylinder is at terminal velocity, acceleration is zero, allowing us to equate the forces:
\( mg – bv_{\text{max}}^2 = 0 \)
\( v_{\text{max}}^2 = \left(\dfrac{g}{b}\right)m \)
This shows that the slope of our graph is equal to \(g/b\). We can rearrange this to solve for \(b\):
\( b = \dfrac{g}{\text{Slope}} \)
\( b = \dfrac{9.8\,\text{m/s}^2}{18\,\text{m}^2/(\text{s}^2\cdot\text{kg})} \approx 0.54\,\text{kg/m} \)
(e)(i)
Vertical axis: Maximum velocity (or \(v_{\text{max}}\))
Horizontal axis: Length of cylinder
(e)(ii)
By plotting the maximum velocity against the different lengths of the cylinders from Set 2 (which all share the same mass), the student can directly observe the relationship. If the graph yields a horizontal line with a slope of zero, it proves that length does not impact the maximum speed. If the graph shows a non-zero slope or a curve, it provides evidence that the cylinder’s length does indeed affect its terminal velocity.