Home / AP® Exam / AP® PreCalculus / AP® Precalculus

AP Precalculus -1.1 Change in Tandem- MCQ Exam Style Questions - Effective Fall 2023

AP Precalculus -1.1 Change in Tandem- MCQ Exam Style Questions – Effective Fall 2023

AP Precalculus -1.1 Change in Tandem- MCQ Exam Style Questions – AP Precalculus- per latest AP Precalculus Syllabus.

AP Precalculus – MCQ Exam Style Questions- All Topics

Question 


A toy car travels around a circular track as shown in the figure. As the toy car travels around the track, its distance from the wall can be modeled by a graph where the \( y \)-axis represents the distance between the car and the wall, and the \( x \)-axis represents time. Which of the following graphs models this relationship as the car goes around the track three times without stopping?

▶️ Answer/Explanation
Detailed solution

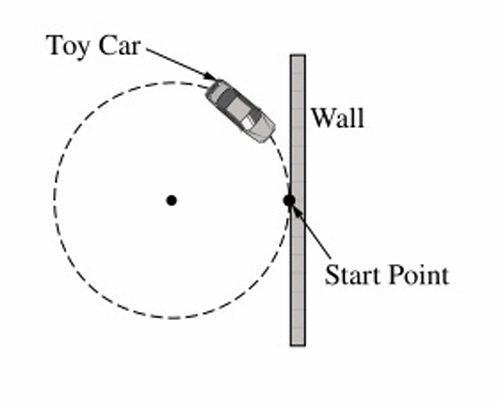
As the car moves around a circular track, its distance from a fixed wall varies periodically: it is closest to the wall at one point and farthest away half a lap later.
One full lap corresponds to one complete cycle of distance variation (from near to far and back to near).
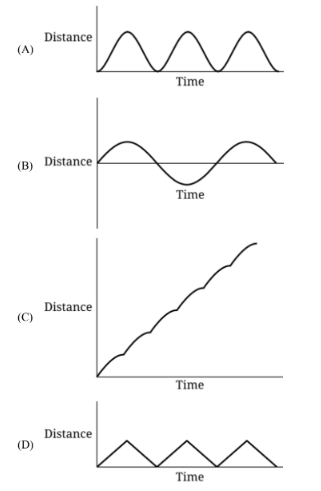
Three laps ⇒ three complete cycles in the distance–time graph.
The graph should therefore be wave-like (sinusoidal or similar), smooth, and periodic with three cycles.
Such a graph matches choice (A).
Answer: (A)

Question 


The figure shows a swimming pool filled with water. A pump is used to remove water from the pool until the pool is empty. When the pump is running, the rate at which the volume of water in the pool decreases is constant. During the first two hours, the pump works slower than usual due to a broken piece. Then the pump stops working. The broken piece is replaced, and the pump works at its usual rate until the pool is completely emptied of water. The entire process of emptying the pool takes six hours. Which of the following graphs could depict this situation, where time, in hours, is the independent variable, and the volume of water in the pool, in gallons, is the dependent variable?
 
▶️ Answer/Explanation
Detailed solution

Sequence of events:
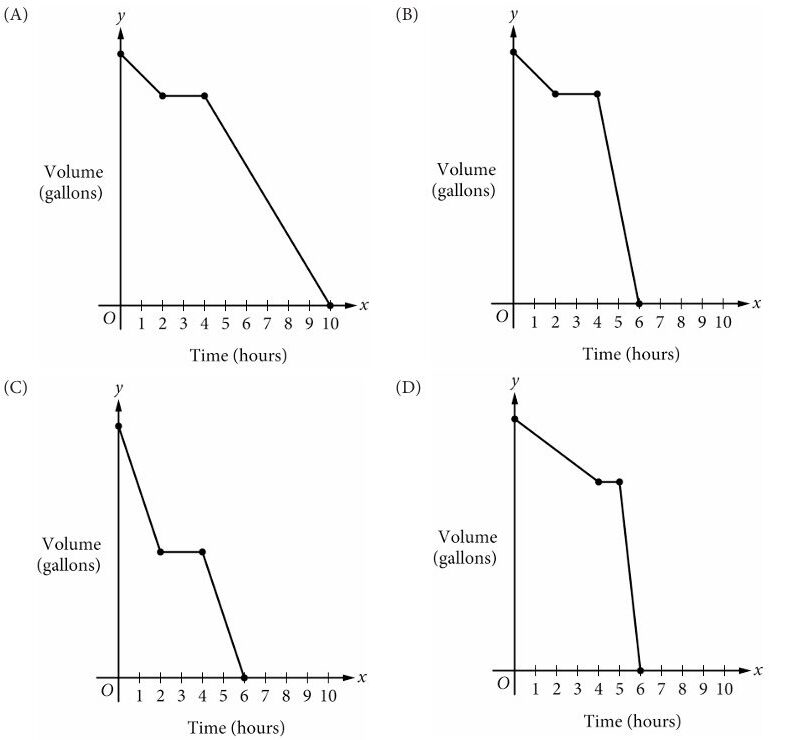
1. First 2 hours: pump works at slower constant rate (volume decreases linearly, shallow slope).
2. Pump stops for some time (volume constant, horizontal segment).
3. Pump resumes at usual (faster) constant rate until empty (volume decreases linearly, steeper slope).
4. Total time = 6 hours.
Graph must show three pieces: shallow decrease, flat, steep decrease, ending at volume 0 by t=6.
From answer key, Graph B matches.
Answer: (B)

Question 

Describe the transformations applied to the graph of the function \(y = f(2x + 1)\) to obtain the graph of the function \(y = f(3x + 2)\). Describe two ways to obtaining the function \(y = f(2x + 1)\) from the original function \(y = f(x)\). Explain your reasoning.
▶️ Answer/Explanation
Detailed solution
Part 1: Transformation from \(y = f(2x + 1)\) to \(y = f(3x + 2)\)
To transform the graph, apply a horizontal translation left by \(\frac{1}{2}\) unit followed by a horizontal compression by a factor of \(\frac{2}{3}\).
Reasoning: Shifting left by \(\frac{1}{2}\) changes \(x \to x + \frac{1}{2}\), giving \(f(2(x+0.5)+1) = f(2x+2)\). Compressing by \(\frac{2}{3}\) changes \(x \to \frac{3}{2}x\), resulting in \(f(2(\frac{3}{2}x)+2) = f(3x+2)\).
Part 2: Two ways to obtain \(y = f(2x + 1)\) from \(y = f(x)\)
Way 1 (Shift then Scale):
First, apply a horizontal translation left by 1 unit to get \(y = f(x+1)\). Then, apply a horizontal compression by a factor of \(\frac{1}{2}\). This replaces \(x\) with \(2x\), resulting in \(y = f(2x+1)\).
Way 2 (Scale then Shift):
First, apply a horizontal compression by a factor of \(\frac{1}{2}\) to get \(y = f(2x)\). Then, apply a horizontal translation left by \(\frac{1}{2}\) unit. This replaces \(x\) with \(x+\frac{1}{2}\), resulting in \(y = f(2(x+0.5)) = f(2x+1)\).
Scroll to Top