Functions, Domain, and Range
Function
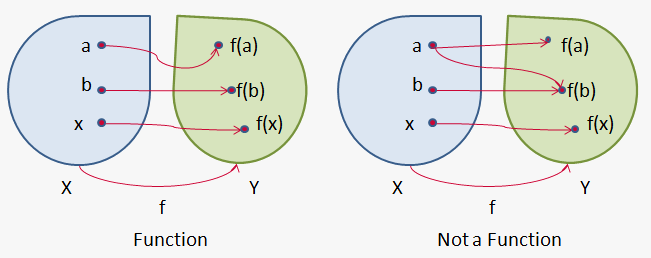
A function is a mathematical relation that assigns each input value to exactly one output value. This means that no single input can be paired with more than one output.
Domain
The domain of a function is the set of all possible input values for which the function is defined.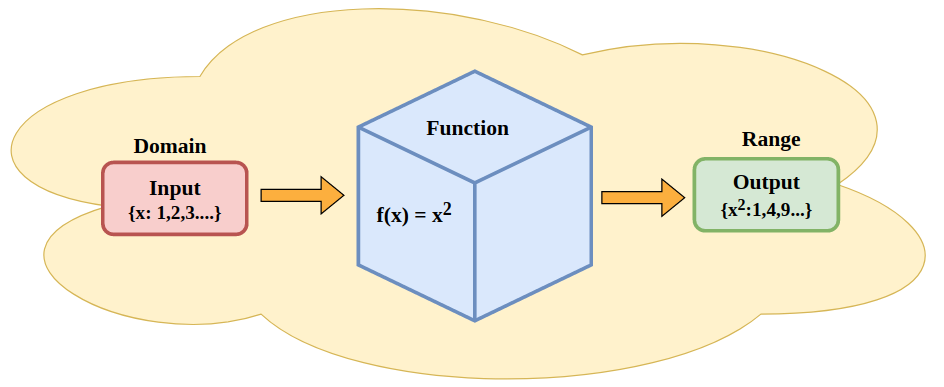
Range
The range of a function is the set of all output values produced by the function when the inputs come from the domain.
Independent and Dependent Variables
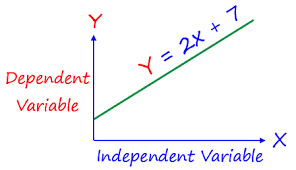
The input variable is called the independent variable and is usually written as \( x \). The output variable is called the dependent variable and is usually written as \( y \) or \( f(x) \), because its value depends on the input.
In function notation, we write \( y = f(x) \), which means that the output is determined by applying the rule \( f \) to the input \( x \).
Example:
Let \( f(x) = 2x + 5 \). Find the domain and the range of the function.
▶️ Answer/Explanation
Domain
The expression \( 2x + 5 \) is defined for every real value of \( x \), so the domain is all real numbers.
Range
As \( x \) takes all real values, \( 2x + 5 \) also takes all real values. Therefore, the range is all real numbers.
Example:
The function \( h(t) = \sqrt{t – 2} \) gives the output for an input \( t \). Find the domain and range of the function.
▶️ Answer/Explanation
Domain
Since a square root is only defined for nonnegative values, we require \( t – 2 \ge 0 \), which gives \( t \ge 2 \).
Range
The square root always produces nonnegative outputs, so the range is \( h(t) \ge 0 \).
Final answer:
Domain: \( t \ge 2 \), Range: \( h(t) \ge 0 \).
Multiple Representations of a Function
The input and output values of a function change together according to a specific rule. This relationship can be described in several different ways, called representations of the function.
A function can be represented:
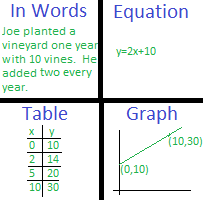
- Graphically by a graph
- Numerically by a table of values
- Analytically by a formula or equation
- Verbally by a written description
All of these representations describe the same underlying relationship between inputs and outputs.
Example:
The function \( f(x) = 2x + 1 \) is given analytically. Represent it numerically and verbally.
▶️ Answer/Explanation
Numerical representation
Choose some input values and compute the outputs.
If \( x = 0 \), then \( f(0) = 1 \)
If \( x = 1 \), then \( f(1) = 3 \)
If \( x = 2 \), then \( f(2) = 5 \)
Verbal representation
The output is always one more than twice the input.
Example:
A car travels at a constant speed of 60 kilometers per hour. Let \( d(t) \) be the distance traveled after \( t \) hours. Represent this situation analytically and graphically.
▶️ Answer/Explanation
Analytical representation
Since distance equals rate times time, the function is \( d(t) = 60t \).
Graphical interpretation
The graph of \( d(t) = 60t \) is a straight line through the origin with slope 60, showing that distance increases steadily as time increases.
Increasing Functions
A function is said to be increasing on an interval of its domain if, whenever the input values increase, the output values also increase.
Mathematically, a function \( f \) is increasing on an interval if for any two numbers \( a \) and \( b \) in that interval,
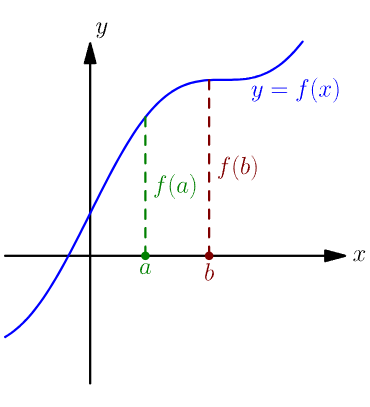
if \( a < b \), then \( f(a) < f(b) \).
This means that the graph of the function rises from left to right over that interval.
Example:
Determine whether the function \( f(x) = 3x + 2 \) is increasing on its domain.
▶️ Answer/Explanation
The function \( f(x) = 3x + 2 \) is a linear function with a positive slope of 3.
For any two numbers \( a < b \), we have
\( f(a) = 3a + 2 \) and \( f(b) = 3b + 2 \).
Since \( b > a \), it follows that \( 3b + 2 > 3a + 2 \), so \( f(b) > f(a) \).
Therefore, \( f(x) \) is increasing for all real values of \( x \).
Example:
The function \( g(x) = x^2 \) is defined on the interval \( x \ge 0 \). Determine whether it is increasing on this interval.
▶️ Answer/Explanation
Choose any two numbers \( a \) and \( b \) such that \( 0 \le a < b \).
Then \( g(a) = a^2 \) and \( g(b) = b^2 \).
Since both \( a \) and \( b \) are nonnegative and \( b > a \), it follows that \( b^2 > a^2 \).
Therefore, \( g(a) < g(b) \), so \( g(x) = x^2 \) is increasing for \( x \ge 0 \).
Decreasing Functions
A function is said to be decreasing on an interval of its domain if, as the input values increase, the output values decrease.
Mathematically, a function \( f \) is decreasing on an interval if for any two numbers \( a \) and \( b \) in that interval,
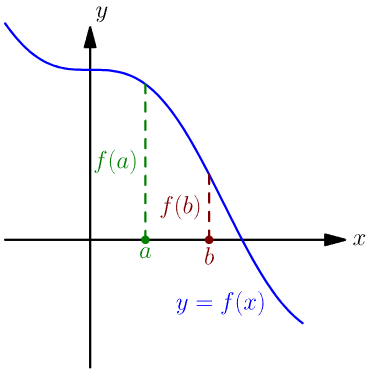
if \( a < b \), then \( f(a) > f(b) \).
This means that the graph of the function falls from left to right over that interval.
Example:
Determine whether the function \( f(x) = -2x + 5 \) is decreasing on its domain.
▶️ Answer/Explanation
The function \( f(x) = -2x + 5 \) is linear with a negative slope of \( -2 \).
For any \( a < b \),
\( f(a) = -2a + 5 \) and \( f(b) = -2b + 5 \).
Since \( b > a \), multiplying by \( -2 \) reverses the inequality, so \( -2b < -2a \), which gives \( f(b) < f(a) \).
Therefore, \( f(x) \) is decreasing for all real \( x \).
Example:
The function \( g(x) = -x^2 \) is defined for all real \( x \). Determine where the function is decreasing.
▶️ Answer/Explanation
Choose two numbers \( a \) and \( b \) with \( a < b \).
Then \( g(a) = -a^2 \) and \( g(b) = -b^2 \).
Since \( b^2 > a^2 \), it follows that \( -b^2 < -a^2 \), so \( g(b) < g(a) \).
Therefore, \( g(x) = -x^2 \) is decreasing for all real values of \( x \).
Constructing a Graph from a Contextual Situation
In many real life situations, two quantities change together. One quantity depends on the other, forming a function.
To construct a graph for such a situation, we identify:
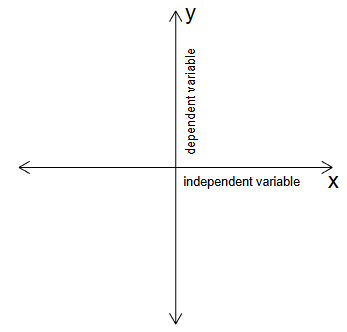
the independent variable on the horizontal axis
the dependent variable on the vertical axis
Each point on the graph represents an input output pair that shows how the two quantities are related.
A contextual graph helps visualize how one quantity changes as the other changes over time, distance, cost, or other measurable quantities.
Example:
A car travels at a constant speed of 60 kilometers per hour. Let \( d \) be the distance traveled after \( t \) hours. Construct a graph representing this situation.
▶️ Answer/Explanation
Step 1 Identify the variables
Time \( t \) is the independent variable and distance \( d \) is the dependent variable.
Step 2 Write the rule
Distance equals rate times time, so \( d = 60t \).
Step 3 Create input output pairs
If \( t = 0 \), then \( d = 0 \)
If \( t = 1 \), then \( d = 60 \)
If \( t = 2 \), then \( d = 120 \)
Step 4 Describe the graph
Plotting these points gives a straight line through the origin that rises steadily, showing that distance increases as time increases.
Example:
The height of a plant increases by 4 centimeters each week. Let \( h \) be the height after \( w \) weeks. Construct a graph to represent this relationship.
▶️ Answer/Explanation
Step 1 Identify the variables
Weeks \( w \) is the independent variable and height \( h \) is the dependent variable.
Step 2 Write the rule
Since the plant grows 4 centimeters each week, \( h = 4w \).
Step 3 Create input output pairs
If \( w = 0 \), then \( h = 0 \)
If \( w = 1 \), then \( h = 4 \)
If \( w = 2 \), then \( h = 8 \)
Step 4 Describe the graph
The graph is a straight line starting at the origin and rising, showing steady growth over time.
Graphs Show Input and Output Values
The graph of a function shows a collection of input output pairs that come from the function rule.
Each point on the graph has coordinates \( (x, y) \), where \( x \) is the input and \( y = f(x) \) is the corresponding output.
By looking at the graph, we can see how the output changes as the input changes, which helps us understand the behavior of the function.
Graphs allow us to visualize patterns such as increasing, decreasing, and constant behavior.
Example:
The function \( f(x) = x^2 \) is graphed. What does the point \( (3, 9) \) on the graph represent?
▶️ Answer/Explanation
The x coordinate 3 is an input value.
The y coordinate 9 is the output of the function when the input is 3.
This means \( f(3) = 9 \), so the point \( (3, 9) \) shows that when the input is 3, the output is 9.
Example:
A graph shows the relationship between time \( t \) and distance \( d \). The point \( (2, 120) \) is on the graph. Interpret this point.
▶️ Answer/Explanation
The input value is \( t = 2 \), which represents 2 units of time.
The output value is \( d = 120 \), which represents the distance after 2 units of time.
So the point means that after 2 units of time, the distance traveled is 120 units.
Concave Up
The graph of a function is said to be concave up on an interval when the rate of change of the function is increasing over that interval.
This means that as the input values increase, the outputs increase faster and faster, or decrease more slowly.
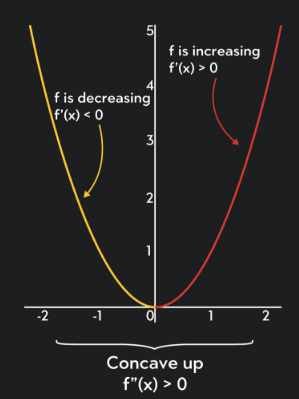
Graphically, a concave up curve looks like a cup opening upward.
When a graph is concave up, the slope of the graph becomes more positive or less negative as \( x \) increases.
Example:
The height of a ball is given by \( h(t) = t^2 \), where \( t \) is time. Explain why the graph is concave up.
▶️ Answer/Explanation
As time increases, the rate at which the height changes increases.
For example, between \( t = 1 \) and \( t = 2 \), the height changes from 1 to 4, an increase of 3.
Between \( t = 2 \) and \( t = 3 \), the height changes from 4 to 9, an increase of 5.
Since the increases are getting larger, the graph bends upward, so it is concave up.
Example:
The cost \( C(x) \) of producing \( x \) items is shown by a graph that becomes steeper as \( x \) increases. What does this say about concavity?
▶️ Answer/Explanation
Since the graph becomes steeper, the rate of change is increasing.
This means the graph is concave up over that interval.
The cost is increasing at an increasing rate as more items are produced.
Concave Down
The graph of a function is said to be concave down on an interval when the rate of change of the function is decreasing over that interval.
This means that as the input values increase, the outputs may still increase, but they do so more slowly, or they may decrease faster and faster.
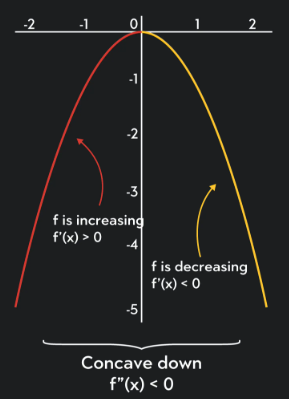
Graphically, a concave down curve looks like an upside down cup.
When a graph is concave down, the slope becomes less positive or more negative as \( x \) increases.
Example:
The height of a thrown ball is given by \( h(t) = -t^2 + 6t \). Explain why the graph is concave down.
▶️ Answer/Explanation
As time increases, the height first increases, then eventually decreases.
The rate at which the height changes is getting smaller over time.
This means the graph bends downward, so it is concave down.
Example:
The revenue from ticket sales increases, but each additional ticket adds less revenue than the previous one. What does this indicate about the graph?
▶️ Answer/Explanation
Since the rate of increase is decreasing, the graph is concave down.
This shows that revenue increases at a decreasing rate.
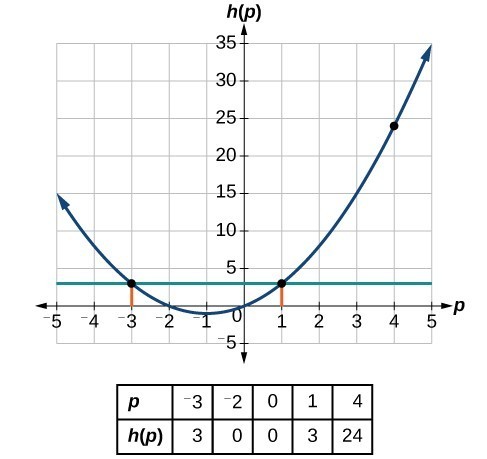
Zeros of a Function and X-Intercepts
The graph of a function intersects the x-axis when the output value of the function is zero.
The input values for which \( f(x) = 0 \) are called the zeros of the function.
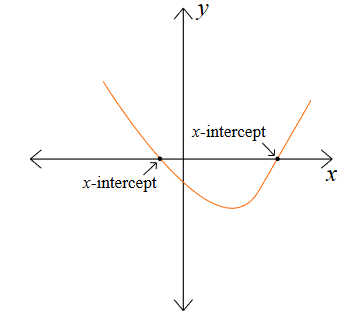
Each zero corresponds to an x-intercept, which is a point where the graph crosses or touches the x-axis.
Finding the zeros of a function helps determine when a quantity becomes zero in real-world contexts.
Example:
Find the zeros of the function \( f(x) = x^2 – 9 \).
▶️ Answer/Explanation
To find the zeros, set the function equal to zero.
\( x^2 – 9 = 0 \)
Factor the expression.
\( (x – 3)(x + 3) = 0 \)
So the zeros are \( x = 3 \) and \( x = -3 \).
These are the x-intercepts of the graph.
Example:
A ball is thrown into the air, and its height is given by \( h(t) = -t^2 + 4t \). When does the ball hit the ground?
▶️ Answer/Explanation
The ball hits the ground when its height is zero.
Set \( h(t) = 0 \).
\( -t^2 + 4t = 0 \)
Factor.
\( t(-t + 4) = 0 \)
So \( t = 0 \) or \( t = 4 \).
This means the ball is on the ground at \( t = 0 \) and hits the ground again at \( t = 4 \) seconds.