Home / AP® Exam / AP® PreCalculus / AP® Precalculus

AP Precalculus -1.2 Rates of Change- FRQ Exam Style Questions - Effective Fall 2023

AP Precalculus -1.2 Rates of Change- FRQ Exam Style Questions – Effective Fall 2023

AP Precalculus -1.2 Rates of Change- FRQ Exam Style Questions – AP Precalculus- per latest AP Precalculus Syllabus.

AP Precalculus – FRQ Exam Style Questions- All Topics

Question

The Chinese bamboo tree exhibits a unique growth pattern. Once a seed has been planted, the Chinese bamboo tree does not break through the ground for several years. However, once it breaks through the ground, the Chinese bamboo tree grows exponentially. In one particular experiment, a group of biologists recorded the height of a Chinese bamboo tree once it broke through the ground. After one week (\(t = 1\)), the Chinese bamboo tree measured 3 feet, and after five weeks (\(t = 5\)), the same tree measured 89 feet.
The height of the Chinese bamboo tree can be modeled by the function \(H\) given by \(H(t) = ab^x\), where \(H(t)\) is the height of the tree, in feet, \(t\) weeks after it first breaks ground.
(A) (i) Use the given data to write two equations that can be used to find the values for constants \(a\) and \(b\) in the expression for \(H(t)\).
(ii) Find the values for \(a\) and \(b\).
(B) (i) Use the given data to find the average rate of change of the height of the Chinese bamboo tree, in feet per week, from \(t = 1\) to \(t = 5\) weeks. Express your answer as a decimal approximation. Show the computations that lead to your answer.
(ii) Interpret the meaning of your answer from (i) in the context of the problem.
(iii) Consider the average rates of change of \(H\) from \(t = 5\) to \(t = p\) weeks, where \(p > 5\). Are these average rates of change less than or greater than the average rate of change from \(t = 1\) to \(t = 5\) weeks found in (i)? Explain your reasoning.
(C) For which \(t\)-value, \(t = 4\) weeks or \(t = 11\) weeks, should the biologists have more confidence in when using the model \(H\)? Give a reason for your answer in the context of the problem.

Most-appropriate topic codes (AP Precalculus CED):

2.5: Exponential Function Context and Data Modeling – part A
1.2: Rates of Change – part B(i), B(ii)
2.3: Exponential Functions – part B(iii)
1.13: Function Model Selection and Assumption Articulation – part C
▶️ Answer/Explanation
Detailed solution

(A)(i) Equations
Substituting the points \((1, 3)\) and \((5, 89)\) into \(H(t) = ab^t\):
1. \(3 = ab^1\) (or \(3 = ab\))
2. \(89 = ab^5\)

(A)(ii) Values for a and b
Dividing equation 2 by equation 1: \(\frac{ab^5}{ab} = \frac{89}{3} \implies b^4 = 29.67\).
Solving for \(b\): \(b = (29.67)^{0.25} \approx 2.33\).
Solving for \(a\): \(a = \frac{3}{2.33} \approx 1.29\).

(B)(i) Average Rate of Change
\(\text{Rate} = \frac{H(5) – H(1)}{5 – 1} = \frac{89 – 3}{4} = \frac{86}{4} = 21.5\)
Answer: 21.5 feet per week.

(B)(ii) Interpretation
The answer indicates that between the first and fifth weeks, the bamboo tree grew at an average speed of 21.5 feet per week.

(B)(iii) Comparison
Greater. The function represents exponential growth (\(b > 1\)), which is concave up. This means the rate of growth increases over time, so the rate after week 5 will be steeper than the rate before week 5.

(C) Confidence
\(t = 4\) weeks.
The biologists should be more confident in \(t=4\) because it is an interpolation (within the observed data range). \(t=11\) is an extrapolation; biological growth cannot remain exponential indefinitely, so the model is likely inaccurate that far out.

Question

An ecologist began studying a certain type of plant species in a wetlands area in 2013. In 2015 ($t=2$), there were 59 plants. In 2021 ($t=8$), there were 118 plants.

The number of plants in this species can be modeled by the function $P$ given by $P(t)=ab^t$, where $P(t)$ is the number of plants during year $t$, and $t$ is the number of years since 2013.

(A)
(i) Use the given data to write two equations that can be used to find the values for constants $a$ and $b$ in the expression for $P(t)$.
(ii) Find the values for $a$ and $b$ as decimal approximations.
(B)
(i) Use the given data to find the average rate of change of the number of plants, in plants per year, from $t=2$ to $t=8$ years. Express your answer as a decimal approximation. Show the computations that lead to your answer.
(ii) Use the average rate of change found in (i) to estimate the number of plants for $t=10$ years. Show the work that leads to your answer.
(iii) The average rate of change found in (i) can be used to estimate the number of plants during year $t$ for $t>10$ years. Will these estimates, found using the average rate of change, be less than or greater than the number of plants predicted by the model $P$ during year $t$ for $t>10$ years? Explain your reasoning.
(C)
For which $t$-value, $t=6$ years or $t=20$ years, should the ecologist have more confidence in when using the model $P$? Give a reason for your answer in the context of the problem.

Most-appropriate topic codes (AP Precalculus CED):

2.5: Exponential Function Context and Data Modeling – part A
1.2: Rates of Change – part B
1.3: Rates of Change in Linear and Quadratic Functions – part B(ii), B(iii)
1.13: Function Model Selection and Assumption Articulation – part C
▶️ Answer/Explanation

A (i)
Because $P(2)=59$ and $P(8)=118$, the two equations to find $a$ and $b$ are $ab^2=59$ and $ab^8=118$.
Answer: $\boxed{ab^2=59 \text{ and } ab^8=118}$

A (ii)
Divide the second equation by the first: $\frac{ab^8}{ab^2} = \frac{118}{59} \implies b^6 = 2$.
$b = (2)^{1/6} \approx 1.122462$.
Substitute $b$ back into the first equation: $a = \frac{59}{b^2} \approx 46.828331$.
Answer: $\boxed{a \approx 46.828, \; b \approx 1.122}$

B (i)
Average Rate of Change = $\frac{P(8)-P(2)}{8-2}$.
Calculation: $\frac{118-59}{6} = \frac{59}{6} \approx 9.833$.
Answer: The average rate of change is $\boxed{9.833 \text{ plants per year}}$.

B (ii)
We can model this estimation using the point-slope form of the secant line: $y = P(2) + r(x-2)$, where $r \approx 9.833$.
For $t=10$: $y = 59 + 9.833(10-2) = 137.667$.
Answer: The number of plants for $t=10$ years was approximately $\boxed{137 \text{ or } 138}$.

B (iii)
The estimate is less than the predicted model value.
Reasoning: The estimate using the average rate of change corresponds to the $y$-coordinate of a point on the secant line that passes through $(2, P(2))$ and $(8, P(8))$. Because an exponential growth graph like $P$ is concave up on the interval $(-\infty, \infty)$, the secant line lies below the curve outside of the interval $(2,8)$. Thus, for $t>10$, the secant line estimate represents an underprediction.

C
The ecologist should have more confidence in using the model for $t=6$ years.
Reasoning: It is appropriate to use the regression model to interpolate values at times that fall between the minimum time ($t=2$) and the maximum time ($t=8$) provided in the data. However, there is insufficient information to know how many years the exponential model can be reliably extended beyond $t=8$ to make reasonable predictions (extrapolation involves more risk and uncertainty).

Question

Students took a math review course to prepare them for college. At the beginning of the course, they were given a pretest to see how much they remembered. At that time \((t = 0)\) the average score was 60 out of 100. The students were then evaluated again at the end of each week. After 4 weeks \((t = 4)\) the average score had increased to 81 out of 100.
The average score can be modeled by \(S(t) = a + b\ln (t + 1)\) , where \(S(t)\) is the average score for month \(t\) , and \(t\) is the number of weeks since the course began.
(A)
(i) Use the given data to write two equations that can be used to find the values for constants \(a\) and \(b\) in the expression \(S(t)\).
(ii) Find the values for \(a\) and \(b\).
(B)
(i) Use the given data to find the average rate of change of the scores in points per week, from \(t = 0\) to \(t = 4\) weeks. Express your answer as a decimal approximation. Show the computations that lead to your answer.
(ii) Interpret the meaning of your answer from (i) in the context of the problem.
(iii) Consider the average rates of change of \(S\) from \(t = 4\) to \(t = p\) weeks, where \(p > 4\). Are these average rates of change less than or greater than the average rate of change from \(t = 0\) to \(t = 4\) months found in (i)? Explain your reasoning.
(C) Explain how the domain values should be limited by the context of the problem.

Most-appropriate topic codes (AP Precalculus CED):

2.14: Logarithmic Function Context and Data Modeling – part A
1.2: Rates of Change – part B
2.11: Logarithmic Functions – part B(iii)
1.13: Function Model Selection and Assumption Articulation – part C
▶️ Answer/Explanation

A (i)
Given \(S(0) = 60\) and \(S(4) = 81\). The equations are: \[ a + b\ln(0+1) = 60 \] \[ a + b\ln(4+1) = 81 \]
Answer: \(a + b\ln(1) = 60\) and \(a + b\ln(5) = 81\).

A (ii)
Since \(\ln(1) = 0\): From the first equation, \(a = 60\). Substituting into the second: \(60 + b\ln(5) = 81 \implies b\ln(5) = 21\). \[ b = \frac{21}{\ln 5} \approx \frac{21}{1.6094} \approx 13.048 \]
Answer: \(a = 60\), \(b \approx 13.048\).

B (i)
The average rate of change from \(t=0\) to \(t=4\): \[ \frac{S(4) – S(0)}{4 – 0} = \frac{81 – 60}{4} = \frac{21}{4} = 5.25 \]
Answer: \(5.25\) points per week.

B (ii)
The value 5.25 represents the average increase in the group’s score per week over the first 4 weeks.
Answer: On average, the students’ scores increased by 5.25 points per week over the first 4 weeks.

B (iii)
The function \(S(t) = a + b\ln(t+1)\) with \(b > 0\) is a logarithmic function. Logarithmic functions are concave down. The average rate of change of a concave down function decreases as the input interval shifts to larger values.
Answer: The average rates of change for \(t = 4\) to \(t = p\) (where \(p > 4\)) will be less than the AROC from \(t=0\) to \(t=4\), because the logarithmic model is concave down, resulting in decreasing rates of change.

C
Time in weeks cannot be negative. Additionally, the context implies a maximum score of 100 on the test. The model predicts scores exceeding 100 for large \(t\) (e.g., \(t > 20.4\)), which is impossible for the context.
Answer: The domain should be limited to non-negative weeks up to the point where the score reaches 100. (Example: \(0 \le t \le 20\)).

Question

A scientist is growing bacteria in a lab. After 2 hours there were 32 bacteria. After 6 hours there were 115 bacteria.
The number of bacteria can be modeled by the function \(P(t) = ab^t\) , where \(P(t)\) is the number of bacteria \(t\) hours after he began.
(A)
(i) Use the given data to write two equations that can be used to find the values for constants \(a\) and \(b\) in the expression for \(P(t)\).
(ii) Find the values for \(a\) and \(b\) as decimal approximations.
(B)
(i) Use the given data to find the average rate of change of the number of bacteria, in bacteria per hour, from \(t = 2\) to \(t = 6\) hours. Express your answer as a decimal approximation. Show the computations that lead to your answer.
(ii) Use the average rate of change in (i) to estimate the number of bacteria for \(t = 9\) hours. Show the computations that lead to your answer.
(iii) The average rate of change found in (i) can be used to estimate the number of bacteria during hour \(t\) for \(t > 9\) hours. Will these estimates, found using the average rate of change, be less than or greater than the number of bacteria predicted by the model during the hour \(t\) for \(t > 9\) hours? Explain your reasoning.
(C) For which \(t\)-value, \(t = 4\) hours or \(t = 15\) hours, should the scientist have more confidence in when using the model \(P\) ? Give a reason for your answer in the context of the problem.

Most-appropriate topic codes (AP Precalculus CED):

2.5: Exponential Function Context and Data Modeling – part A
1.2: Rates of Change – part B
1.3: Rates of Change in Linear and Quadratic Functions – part B(ii), B(iii)
1.13: Function Model Selection and Assumption Articulation – part C
▶️ Answer/Explanation

A (i)
Using the model \(P(t) = ab^t\): From the data, \(P(2) = 32\) and \(P(6) = 115\).
The two equations are: \[ ab^2 = 32 \] \[ ab^6 = 115 \]
Answer: The system of equations is \(ab^2 = 32\) and \(ab^6 = 115\).

A (ii)
Divide the second equation by the first: \[ \frac{ab^6}{ab^2} = \frac{115}{32} \implies b^4 = \frac{115}{32} \] Taking the positive fourth root (since \(b > 0\)): \[ b = \left(\frac{115}{32}\right)^{1/4} \approx 1.377 \] Substitute \(b\) into the first equation: \[ a(1.377)^2 = 32 \implies a \approx \frac{32}{1.896} \approx 16.880 \]
Answer: \(a \approx 16.880\), \(b \approx 1.377\).

B (i)
The average rate of change (AROC) of \(P\) from \(t=2\) to \(t=6\) is: \[ \frac{P(6) – P(2)}{6 – 2} = \frac{115 – 32}{4} = \frac{83}{4} = 20.75 \]
Answer: The average rate of change is \(20.75\) bacteria per hour.

B (ii)
Using the AROC, the change in bacteria from \(t=2\) to \(t=9\) is approximated by \(20.75 \times (9-2) = 20.75 \times 7 = 145.25\). Estimated number of bacteria at \(t=9\): \[ P(9) \approx P(2) + 145.25 = 32 + 145.25 = 177.25 \] Since bacteria count is discrete, this is approximately 177 or 178 bacteria.
Answer: Approximately 177 bacteria.

B (iii)
The model \(P(t)=ab^t\) is an exponential growth function. Exponential functions are concave up. The secant line used for the AROC estimate lies below the graph of a concave up function. Therefore, linear estimates based on the secant line will be less than the actual values predicted by the model.
Answer: The estimates using the average rate of change will be less than the number of bacteria predicted by the model, because the exponential model is concave up, placing the secant line below the curve.

C
Interpolation (estimating between known data points) is generally more reliable than extrapolation (estimating beyond the range of data). The value \(t=4\) lies within the interval \([2, 6]\) used to build the model, while \(t=15\) lies far outside this interval. The behavior of the bacteria may change over longer periods, making the model less reliable.
Answer: The scientist should have more confidence at \(t = 4\) hours because 4 is between the given data points (interpolation), whereas 15 is outside the known range (extrapolation).

Question

A dog food bowl has a certain number of dog food pellets. A dog eats a fraction of the remaining food per minute. At \(t = 1\) minute, 145 pellets are left; at \(t = 2\) minutes, 115 pellets are left. The situation is modeled by \(P(t) = ae^{bt}\), where \(P(t)\) is the number of pellets left after \(t\) minutes.
(A) Find an exponential function that models this situation.
(B) (i) Find the average rate of change from \(t = 0\) to \(t = 4\). Explain its meaning.
(ii) Will the average rate of change from \(t = 4\) to \(t = t_a\) (with \(t_a > 4\)) be greater or less than that from \(t = 0\) to \(t = 4\)? Justify.
(C) As \(t \to \infty\), does the model make sense contextually? Why or why not?

Most-appropriate topic codes (AP Precalculus CED):

2.5: Exponential Function Context and Data Modeling – part (A), part (C)
1.2: Rates of Change – part (B)(i), (B)(ii)
2.3: Exponential Functions – part (B)(ii)
3.2: Apply numerical results in a given mathematical or applied context – part (B)(i), (C)
3.3: Support conclusions or choices with a logical rationale or appropriate data – part (B)(ii), (C)
▶️ Answer/Explanation
Detailed solution

(A) Exponential model \(P(t) = ae^{bt}\)

  • Given: \(P(1) = 145\), \(P(2) = 115\).
  • Divide the equations: \(\frac{P(2)}{P(1)} = \frac{115}{145} = \frac{23}{29} \approx 0.7931 = e^{b(2-1)} = e^b\).
  • So \(b = \ln\left(\frac{23}{29}\right) \approx \ln(0.7931) \approx -0.2318\).
  • Use \(P(1) = ae^{b\cdot1} = 145\): \(a = 145 \cdot e^{-b} = 145 \cdot \frac{29}{23} \approx 145 \cdot 1.2609 \approx 182.83\).
  • Alternatively, compute directly: \(a = P(1) e^{-b} = 145 \cdot \frac{29}{23} = \frac{145 \cdot 29}{23} = \frac{4205}{23} \approx 182.826\).
  • Thus, \(P(t) \approx 182.826 e^{-0.2318 t}\).

(B) i. Average rate of change from \(t = 0\) to \(t = 4\)

  • \(P(0) = a \approx 182.826\).
  • \(P(4) = 182.826 e^{-0.2318 \cdot 4} \approx 182.826 e^{-0.9272} \approx 182.826 \cdot 0.3956 \approx 72.34\).
  • Average rate = \(\frac{P(4) – P(0)}{4 – 0} \approx \frac{72.34 – 182.826}{4} = \frac{-110.486}{4} \approx -27.622\) pellets per minute.
  • Meaning: On average over the first 4 minutes, the dog ate about 27.6 pellets per minute.

(B) ii. Comparison of average rates

  • For an exponential decay \(P(t) = ae^{bt}\) with \(b < 0\), the function is decreasing and concave up (since \(P”(t) = ab^2 e^{bt} > 0\)).
  • In a concave up decreasing function, the average rate of change over an interval decreases in magnitude (becomes less negative) as the interval moves to the right.
  • Thus, the average rate from \(t = 4\) to \(t = t_a\) will be greater (less negative) than that from \(t = 0\) to \(t = 4\).
  • Reason: The instantaneous rate (derivative) is negative but increasing (becoming less negative), so later intervals have a smaller rate of loss.

(C) Limit as \(t \to \infty\)

  • \(\lim_{t \to \infty} P(t) = \lim_{t \to \infty} ae^{bt} = 0\) because \(b < 0\).
  • Context: The model predicts the pellets approach zero but never actually reach it. In reality, the dog will finish all pellets in finite time, so the model is not perfectly accurate for very large \(t\). However, it is a good approximation for the decay process while pellets remain.
  • Thus, the model does not fully make sense as \(t \to \infty\) because it predicts the dog never finishes, while in reality the bowl becomes empty at some finite time.

Question

An increasing, continuous function \(g(x)\) has outputs of some values of \(x\) shown in the table. \(f(x)\) is a function shown to the right as the graph.
(A) (i) Estimate the value of \(g(f^{-1}(1))\) for all values if it is defined.
(ii) If \(h(x) = \frac{g(x)}{f(x)}\), then define any discontinuities, their type, and their location when \(x > 0\).
(B) Suppose \(j(x) = \frac{1}{4.998} \ln(x) \cdot e^{2\sin(\sqrt{x})}\) could be used to model \(f(x)\).
(i) Determine the end behavior of \(j\) when \(x\) increases without bound.Express your answer with the mathematical definition of a limit if it exists. If it does not exist, explain why.
(ii) Determine the vertical asymptote of \(j\) when \(x\) approaches 0 from the right.Express your answer with the mathematical definition of a limit if it exists. If it does not, explain why.
(C) Determine if \(g(x)\), using the values in the table, can be best modeled with a linear, quadratic, exponential, or logarithmic function. Explain your answer based on the relationship between the change
in the output values of 𝑔 and the change in the input values of 𝑔.

Most-appropriate topic codes (AP Precalculus CED):

1.9: Rational Functions and Vertical Asymptotes – part A(ii)
2.3: Exponential Functions – part B(i), B(ii)
2.8: Inverse Functions – part A(i)
2.11: Logarithmic Functions – part B(i), B(ii), C
2.14: Logarithmic Function Context and Data Modeling – part C
▶️ Answer/Explanation
Detailed solution

(A) i. \(g(f^{-1}(1))\)

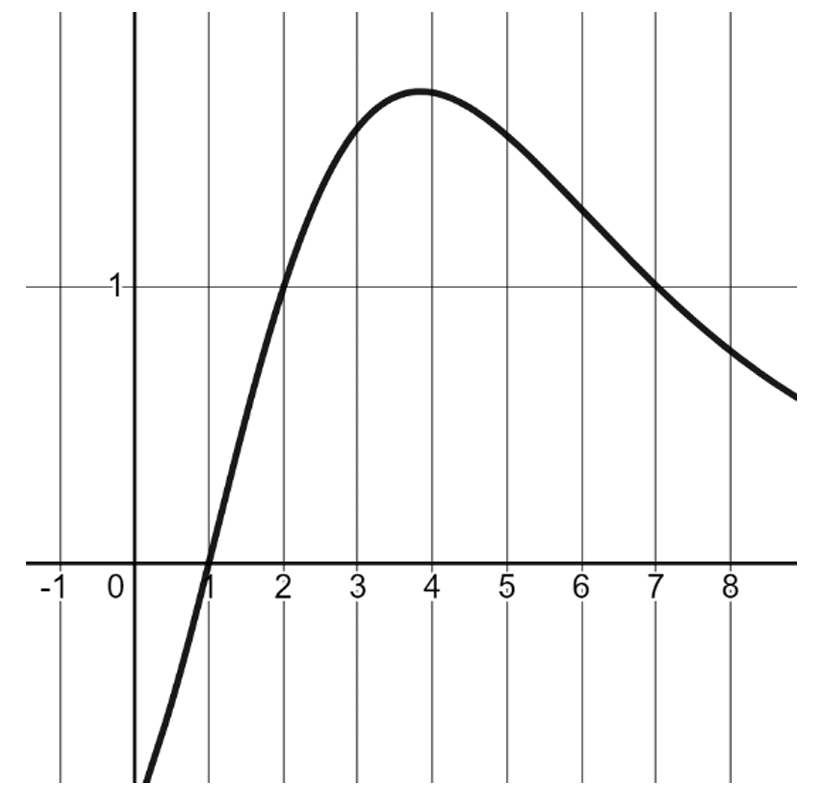
  • From the graph of \(f(x)\), \(f^{-1}(1)\) means find \(x\) such that \(f(x) = 1\).
  • From the graph, \(f(x) = 1\) at approximately \(x \approx 2.5\). So \(f^{-1}(1) \approx 2.5\).
  • From the table, \(g(2) = 1\), \(g(4) = 2\). Since \(g\) is increasing and continuous, by linear interpolation for \(x \approx 2.5\): \(g(2.5) \approx 1 + \frac{2.5-2}{4-2} \cdot (2-1) = 1 + 0.25 = 1.25\).
  • Thus, \(g(f^{-1}(1)) \approx 1.25\).

(A) ii. \(h(x) = \frac{g(x)}{f(x)}\), \(x > 0\)

  • Discontinuities occur where \(f(x) = 0\) or where \(f\) is undefined (but \(f\) appears continuous from the graph for \(x>0\)).
  • From the graph, \(f(x) = 0\) at \(x \approx 1.5\) (where graph crosses x-axis). That is the only zero of \(f\) for \(x>0\).
  • At \(x \approx 1.5\), \(g(x) \neq 0\) (since \(g\) is about 0.5 between \(g(1)=0\) and \(g(2)=1\)).
  • Thus, \(h(x)\) has a vertical asymptote at \(x \approx 1.5\) because denominator → 0, numerator nonzero → \(h(x) \to \pm\infty\).
  • Type: infinite discontinuity (vertical asymptote).

(B) i. End behavior of \(j(x) = \frac{1}{4.998} \ln(x) \cdot e^{2\sin(\sqrt{x})}\) as \(x \to \infty\)

  • As \(x \to \infty\), \(\ln(x) \to \infty\).
  • The factor \(e^{2\sin(\sqrt{x})}\) oscillates between \(e^{-2}\) and \(e^{2}\) because \(\sin(\sqrt{x})\) oscillates in \([-1,1]\).
  • Thus \(j(x)\) oscillates with amplitude growing like \(\ln(x)\). The limit does not exist because oscillations persist and amplitude grows without bound.
  • Limit expression: \(\lim_{x \to \infty} j(x)\) does not exist.

(B) ii. Vertical asymptote as \(x \to 0^+\)

  • As \(x \to 0^+\), \(\ln(x) \to -\infty\).
  • The factor \(e^{2\sin(\sqrt{x})} \to e^{0} = 1\) (since \(\sqrt{x} \to 0\), \(\sin(\sqrt{x}) \to 0\)).
  • Thus \(j(x) \to -\infty\).
  • Limit expression: \(\lim_{x \to 0^+} j(x) = -\infty\). So vertical asymptote at \(x=0\).

(C) Best model for \(g(x)\) from the table:

  • Check changes in \(g(x)\) as \(x\) doubles:
  • From \(x=0.5\) to \(x=1\), \(\Delta g = 1\).
  • From \(x=1\) to \(x=2\), \(\Delta g = 1\).
  • From \(x=2\) to \(x=4\), \(\Delta g = 1\).
  • From \(x=4\) to \(x=8\), \(\Delta g = 1\).
  • Each time \(x\) doubles, \(g(x)\) increases by about 1. This suggests a logarithmic relationship: \(g(x) \approx a + b \ln(x)\).
  • Thus, \(g(x)\) is best modeled by a logarithmic function.

Question

A musician released a new song on a streaming service. A streaming service is an online entertainment source that allows users to play music on their computers and mobile devices.
Several months later, the musician began using an app (at time \( t = 0 \)) that counts the total number of plays for the song since its release. A “play” is a single stream of the song on the streaming service. The table gives the total number of plays, in thousands, for selected times \( t \) months after the musician began using the app.

The total number of plays, in thousands, for the song since its release can be modeled by the function \( D(t) = at^2 + bt + c \), where \( D(t) \) is the total number of plays, in thousands, for the song since its release, and \( t \) is the number of months after the musician began using the app.
(A)
(i) Use the given data to write three equations that can be used to find the values for constants \( a \), \( b \), and \( c \) in the expression for \( D(t) \).
(ii) Find the values for \( a \), \( b \), and \( c \) as decimal approximations.
(B)
(i)Use the given data to find the average rate of change of the total number of plays for the song, in thousands per month, from \( t = 0 \) to \( t = 4 \) months. Express your answer as a decimal approximation. Show the computations that lead to your answer.
(ii) Use the average rate of change found in part B (i) to estimate the total number of plays for the song, in thousands, for \( t = 1.5 \) months. Show the work that leads to your answer.
(iii) Let \( A_t \) represent the estimate of the total number of plays for the song, in thousands, using the average rate of change found in part B (i). For \( A_{1.5} \) found in part B (ii), it can be shown that \( A_{1.5} < D(1.5) \). Explain why, in general, \( A_t < D(t) \) for all \( t \), where \( 0 < t < 4 \). Your explanation should include a reference to the graph of \( D \) and its relationship to \( A_t \).
(C) The quadratic function model \( D \) has exactly one absolute minimum or one absolute maximum. That minimum or maximum can be used to determine a boundary for the domain of \( D \). Based on the context of the problem, explain how that minimum or maximum can be used to determine a boundary for the domain of \( D \).

Most-appropriate topic codes (AP Precalculus 2024):

1.11: Rewrite polynomial expressions in equivalent forms — parts A(i), A(ii)
1.2: Compare rates of change using average rates of change — part B(i)
2.5: Construct a model for situations involving proportional output values — part B(ii)
1.3: Determine the change in average rates of change for quadratic functions — part B(iii)
1.13: Articulate model assumptions and domain restrictions — part C
▶️ Answer/Explanation

A.

(i)
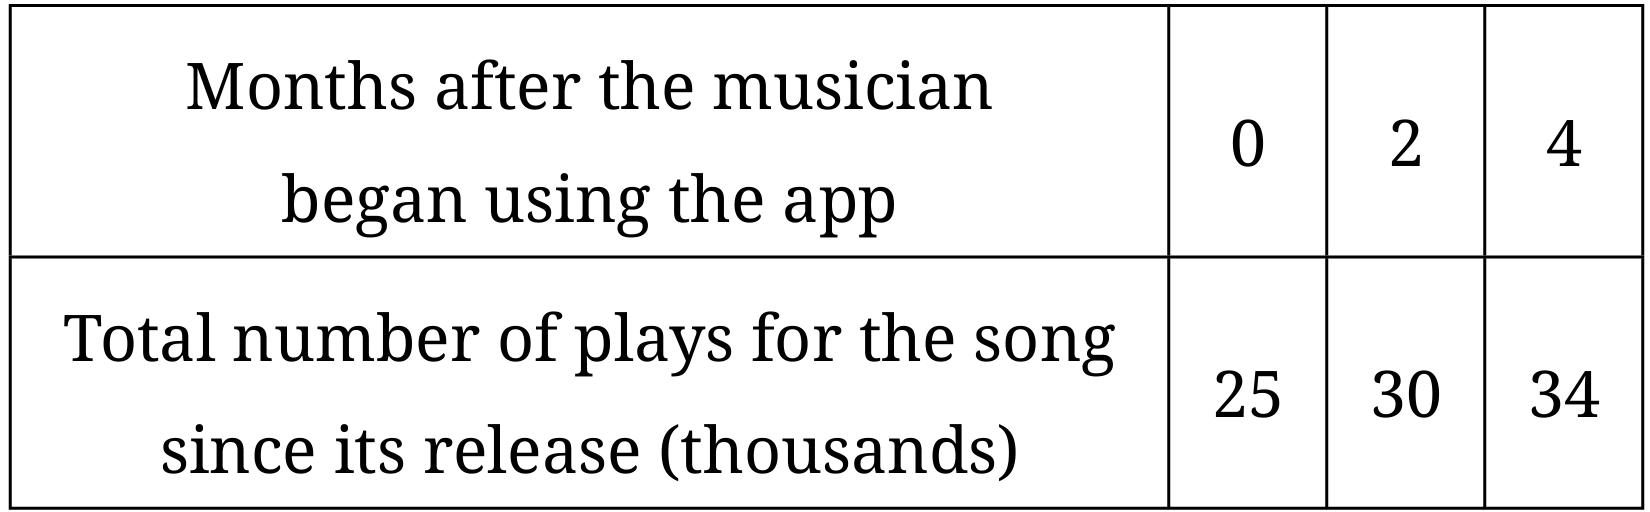
Because \( D(0) = 25 \), \( D(2) = 30 \), and \( D(4) = 34 \), the three equations are: \[ \begin{align*} a(0)^2 + b(0) + c &= 25 \\ a(2)^2 + b(2) + c &= 30 \\ a(4)^2 + b(4) + c &= 34 \end{align*} \] These simplify to: \[ \begin{align*} c &= 25 \quad \text{(1)} \\ 4a + 2b + c &= 30 \quad \text{(2)} \\ 16a + 4b + c &= 34 \quad \text{(3)} \end{align*} \] ✅ Answer: \(\boxed{c=25, \; 4a+2b+c=30, \; 16a+4b+c=34}\)

(ii)
Substitute \( c = 25 \) into (2) and (3): \[ \begin{align*} 4a + 2b &= 5 \quad \text{(2′)} \\ 16a + 4b &= 9 \quad \text{(3′)} \end{align*} \] Multiply (2′) by 2: \( 8a + 4b = 10 \).
Subtract this from (3′): \( (16a+4b) – (8a+4b) = 9 – 10 \) gives \( 8a = -1 \), so \( a = -\frac{1}{8} = -0.125 \).
Substitute into (2′): \( 4(-0.125) + 2b = 5 \) gives \( -0.5 + 2b = 5 \), so \( 2b = 5.5 \), \( b = 2.75 \).
Answer: \(\boxed{a = -0.125, \; b = 2.75, \; c = 25}\)
Thus, \( D(t) = -0.125t^2 + 2.75t + 25 \).


B.

(i)
Average rate of change from \( t=0 \) to \( t=4 \): \[ \frac{D(4)-D(0)}{4-0} = \frac{34 – 25}{4} = \frac{9}{4} = 2.25 \] ✅ Answer: \(\boxed{2.25}\) thousand plays per month.

(ii)
Using the average rate of change, the linear estimate is \( A_t = D(0) + 2.25t = 25 + 2.25t \).
For \( t = 1.5 \): \[ A_{1.5} = 25 + 2.25(1.5) = 25 + 3.375 = 28.375 \] ✅ Answer: \(\boxed{28.375}\) thousand plays.

(iii)
The estimate \( A_t \) is the \( y \)-coordinate of a point on the secant line passing through \( (0, D(0)) \) and \( (4, D(4)) \).
Since \( D(t) \) is a quadratic with \( a = -0.125 < 0 \), its graph is concave down on \( 0 < t < 4 \).
For a concave-down function over an interval, the secant line connecting the endpoints lies below the graph of the function for all \( t \) in the open interval \( (0, 4) \).
Therefore, \( A_t < D(t) \) for all \( t \) where \( 0 < t < 4 \).
Explanation: Concave-down shape places the secant line below the curve.


C.
The quadratic \( D(t) = -0.125t^2 + 2.75t + 25 \) has \( a < 0 \), so it has an absolute maximum (vertex).
Find vertex: \( t = -\frac{b}{2a} = -\frac{2.75}{2(-0.125)} = \frac{2.75}{0.25} = 11 \) months.
In the context, \( D(t) \) models the total number of plays since release, which cannot decrease. However, the quadratic model decreases after \( t = 11 \) (its maximum), which would imply the total plays go down—impossible in reality.
Therefore, the model is only valid up to the time it reaches its maximum. The domain of \( D \) should be restricted to \( t \le 11 \) months (or until the maximum is reached) to ensure the total plays are non-decreasing.
Explanation: The absolute maximum at \( t = 11 \) gives a right endpoint for the domain because the total plays cannot decrease after that time.

Question

On the initial day of sales (\( t=0 \)) for a new video game, there were \( 40 \) thousand units of the game sold that day. Ninety-one days later (\( t=91 \)), there were \( 76 \) thousand units of the game sold that day.
The number of units of the video game sold on a given day can be modeled by the function \( G(t)=\ln(a+bt+1) \), where \( G(t) \) is the number of units sold, in thousands, on day \( t \) since the initial day of sales.
(A)
(i) Use the given data to write two equations that can be used to find the values for constants \( a \) and \( b \) in the expression for \( G(t) \).
(ii) Find the values for \( a \) and \( b \) as decimal approximations.
(B)
(i) Use the given data to find the average rate of change of the number of units of the video game sold, in thousands per day, from \( t=0 \) to \( t=91 \) days. Express your answer as a decimal approximation. Show the computations that lead to your answer.
(ii) Use the average rate of change found in part (i) to estimate the number of units of the video game sold, in thousands, on day \( t=50 \). Show the work that leads to your answer.
(iii) Let \( A_t \) represent the estimate of the number of units of the video game sold, in thousands, using the average rate of change found in part (i). For \( A_{50} \), found in part (ii), it can be shown that \( A_{50} < G(50) \). Explain why, in general, \( A_t < G(t) \) for all \( 0<t<91 \).
(C)
The makers of the video game reported that daily sales of the video game decreased each day after \( t=91 \). Explain why the error in the model \( G \) increases after \( t=91 \).

Most-appropriate topic codes (CED):

TOPIC 2.11: Logarithmic Models — part (A)
TOPIC 1.2: Average Rate of Change — part (B)
TOPIC 1.4: Function Behavior — part (C)
▶️ Answer/Explanation
Concise solution

(A)(i)
\( G(0)=\ln(a+1)=40 \)
\( G(91)=\ln(a+91b+1)=76 \)

(A)(ii)
From \( \ln(a+1)=40 \Rightarrow a+1=e^{40} \).
From \( \ln(a+91b+1)=76 \Rightarrow a+91b+1=e^{76} \).
Subtracting gives \( 91b=e^{76}-e^{40} \Rightarrow b=\frac{e^{76}-e^{40}}{91} \).

(B)(i)
Average rate of change \(=\frac{76-40}{91}=\frac{36}{91}\approx0.396 \).

(B)(ii)
\( A_{50}=40+0.396(50)=59.8 \).

(B)(iii)
\( G(t) \) is increasing and concave down, so the secant line from \( t=0 \) to \( t=91 \) lies below the graph for \( 0<t<91 \).

(C)
After \( t=91 \), actual sales decrease while the model \( G \) continues to increase, so the difference between actual values and model values grows.

Question 

A student won $500$ in an art contest. At first, the student kept the money in a desk. After $10$ months, the student deposited the money in a savings account that earned interest. Six months after depositing the money ($t = 6$), the amount in the account is $508.67$. Twelve months after depositing the money ($t = 12$), the amount in the account is $517.50$.
The amount of money the student has can be modeled by the piecewise function $M$ given by: $$M(t) = \begin{cases} 500 & \text{for } -10 \le t < 0 \\ ab^{(t/12)} & \text{for } t \ge 0 \end{cases}$$ where $M(t)$ is the amount, in dollars, at time $t$ months since the $500$ was deposited into the savings account. A negative value for $t$ represents the number of months before the student deposited the $500$ into the savings account.

Part A

(i) Use the given data to write two equations that can be used to find the values for constants $a$ and $b$ in the expression for $M(t)$.
(ii) Find the values for $a$ and $b$ as decimal approximations.

Part B

(i) Use the given data to find the average rate of change of the amount of money the student has, in dollars per month, from $t = -2$ to $t = 12$ months. Express your answer as a decimal approximation. Show the computations that lead to your answer.
(ii) Use $M(12)$ and the average rate of change found in (i) to estimate the amount of money, in dollars, the student has when $t = 20$ months. Show the work that leads to your answer.
(iii) Let $A(t)$ be the estimate of the amount of money, in dollars, the student has at time $t$ months using the average rate of change found in (i). If $A(t)$ is used to estimate values for $M(t)$ for $t > 12$, the error in the estimates will increase as $t$ increases. Explain why this is true.

Part C

The student plans to close the account when the amount of money in the account reaches $565$. Explain how this information can be used to determine the domain limitations for the model $M$.
▶️ Answer/Explanation
Detailed solution

Part A

(i)
Using the data $M(6) = 508.67$ and $M(12) = 517.50$:
$ab^{(6/12)} = 508.67$ (or $ab^{0.5} = 508.67$)
$ab^{(12/12)} = 517.50$ (or $ab = 517.50$)

(ii)
Divide the second equation by the first: $\frac{ab}{ab^{0.5}} = \frac{517.50}{508.67}$
$b^{0.5} \approx 1.017359…$
$b \approx (1.017359…)^2 \approx 1.035019…$
Using $ab = 517.50 \implies a = \frac{517.50}{1.035019…} \approx 500$
Final values: $a \approx 500.00$ and $b \approx 1.035$

Part B

(i)
$t = -2$ falls in the interval $-10 \le t < 0$, so $M(-2) = 500$.
$t = 12$ is given as $M(12) = 517.50$.
Average Rate of Change $= \frac{M(12) – M(-2)}{12 – (-2)}$
$= \frac{517.50 – 500}{12 + 2}$
$= \frac{17.50}{14} = 1.25$ dollars per month.

(ii)
The linear estimate $A(t)$ uses the point $(12, 517.50)$ and slope $1.25$.
$A(20) = M(12) + 1.25(20 – 12)$
$A(20) = 517.50 + 1.25(8)$
$A(20) = 517.50 + 10 = 527.50$ dollars.

(iii)
The model $M(t)$ for $t \ge 0$ is an exponential function ($b > 1$), which is concave up.
The estimate $A(t)$ is a linear function (a secant line).
Since $M(t)$ is increasing at an increasing rate (exponential growth), the linear model will fall further behind the actual values as $t$ increases.

Part C

The model is only valid as long as the account is open.
Setting $M(t) = 565$ allows us to solve for the maximum value of $t$.
$500(1.035)^{(t/12)} = 565$
This value of $t$ serves as the upper bound (maximum) for the domain of the model $M$.

Question 

The figure shows a robotic arm rotating in a circular counterclockwise direction that completes one rotation every $2$ seconds. Point $S$ is on the tip of the arm, and point $X$ does not move. As the arm rotates at a constant speed, the height of $S$ above $X$ periodically increases and decreases. At time $t = 0$ seconds, $S$ is at its lowest position, $6$ inches directly below $X$. At its highest position, $S$ is $20$ inches directly above $X$.
The sinusoidal function $h$ models the height of $S$ above $X$, in inches, as a function of time $t$, in seconds. A positive value of $h(t)$ indicates $S$ is above $X$; a negative value of $h(t)$ indicates $S$ is below $X$.
Part A
The graph of $h$ and its dashed midline for two full cycles is shown. Five points, $F, G, J, K,$ and $P$, are labeled on the graph. Determine possible coordinates $(t, h(t))$ for the five points.
Part B
The function $h$ can be written in the form $h(t) = a \cos(b(t + c)) + d$. Find values of constants $a, b, c,$ and $d$.
Part C
Refer to the graph of $h$ in part (A). The $t$-coordinate of $K$ is $t_1$, and the $t$-coordinate of $P$ is $t_2$.
(i) On the interval $(t_1, t_2)$, which of the following is true about $h$?
      a. $h$ is positive and increasing.
      b. $h$ is positive and decreasing.
      c. $h$ is negative and increasing.
      d. $h$ is negative and decreasing.
(ii) Describe how the rate of change of $h$ is changing on the interval $(t_1, t_2)$.
▶️ Answer/Explanation
Detailed solution

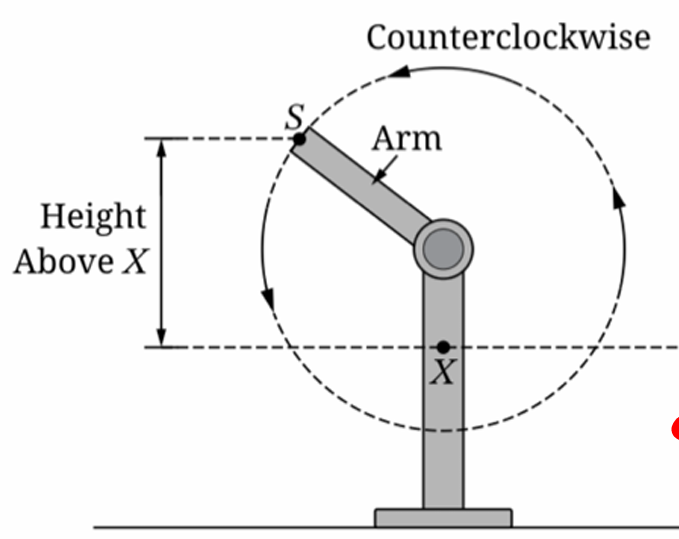
Part A: Coordinates of Points

At $t = 0$, $S$ is at its minimum height $-6$ (below $X$).
The maximum height is $20$.
The midline $d = \frac{20 + (-6)}{2} = 7$.
The period is $2$ seconds.
The graph starts at a minimum at $t = 0$, reaches midline at $t = 0.5$, maximum at $t = 1$, midline at $t = 1.5$, and minimum at $t = 2$.
Based on the visual positions in the provided graph:
$F$ (first maximum): $(1, 20)$
$G$ (midline, decreasing): $(1.5, 7)$
$J$ (minimum): $(2, -6)$
$K$ (midline, increasing): $(2.5, 7)$
$P$ (second maximum): $(3, 20)$

Part B: Finding Constants

$a$ (Amplitude) $= \frac{20 – (-6)}{2} = 13$. Since we use $\cos$ and start at a minimum, $a = -13$ (or use a phase shift).
$d$ (Vertical shift/Midline) $= 7$.
$b$ (Frequency factor) $= \frac{2\pi}{\text{period}} = \frac{2\pi}{2} = \pi$.
$c$ (Phase shift): For $h(t) = a \cos(b(t+c)) + d$, if $a = -13$, then at $t=0$, $-13\cos(b(0+c))+7 = -6 \implies \cos(bc)=1 \implies c = 0$.
Final values: $a = -13, b = \pi, c = 0, d = 7$.

Part C: Interval Analysis

(i) At $K$, $h(t)=7$ and is increasing. At $P$, $h(t)=20$ (maximum).
On $(t_1, t_2)$, the height is between $7$ and $20$, so it is positive.
The graph is moving from the midline up to the peak, so it is increasing.
Correct Option: a

(ii) On the interval $(t_1, t_2)$, the graph is concave down as it approaches the maximum.
Therefore, the rate of change of $h$ (the slope) is decreasing.
It starts at its maximum positive value at $K$ and decreases toward zero at $P$.

Question 

A student won $500$ in an art contest. At first, the student kept the money in a desk. After $10$ months, the student deposited the money in a savings account that earned interest. Six months after depositing the money ($t = 6$), the amount in the account is $508.67$. Twelve months after depositing the money ($t = 12$), the amount in the account is $517.50$.
The amount of money the student has can be modeled by the piecewise function $M$ given by: $$M(t) = \begin{cases} 500 & \text{for } -10 \le t < 0 \\ ab^{(t/12)} & \text{for } t \ge 0 \end{cases}$$ where $M(t)$ is the amount, in dollars, at time $t$ months since the $500$ was deposited into the savings account. A negative value for $t$ represents the number of months before the student deposited the $500$ into the savings account.

Part A

(i) Use the given data to write two equations that can be used to find the values for constants $a$ and $b$ in the expression for $M(t)$.
(ii) Find the values for $a$ and $b$ as decimal approximations.

Part B

(i) Use the given data to find the average rate of change of the amount of money the student has, in dollars per month, from $t = -2$ to $t = 12$ months. Express your answer as a decimal approximation. Show the computations that lead to your answer.
(ii) Use $M(12)$ and the average rate of change found in (i) to estimate the amount of money, in dollars, the student has when $t = 20$ months. Show the work that leads to your answer.
(iii) Let $A(t)$ be the estimate of the amount of money, in dollars, the student has at time $t$ months using the average rate of change found in (i). If $A(t)$ is used to estimate values for $M(t)$ for $t > 12$, the error in the estimates will increase as $t$ increases. Explain why this is true.

Part C

The student plans to close the account when the amount of money in the account reaches $565$. Explain how this information can be used to determine the domain limitations for the model $M$.
▶️ Answer/Explanation
Detailed solution

Part A

(i)
Using the data $M(6) = 508.67$ and $M(12) = 517.50$:
$ab^{(6/12)} = 508.67$ (or $ab^{0.5} = 508.67$)
$ab^{(12/12)} = 517.50$ (or $ab = 517.50$)

(ii)
Divide the second equation by the first: $\frac{ab}{ab^{0.5}} = \frac{517.50}{508.67}$
$b^{0.5} \approx 1.017359…$
$b \approx (1.017359…)^2 \approx 1.035019…$
Using $ab = 517.50 \implies a = \frac{517.50}{1.035019…} \approx 500$
Final values: $a \approx 500.00$ and $b \approx 1.035$

Part B

(i)
$t = -2$ falls in the interval $-10 \le t < 0$, so $M(-2) = 500$.
$t = 12$ is given as $M(12) = 517.50$.
Average Rate of Change $= \frac{M(12) – M(-2)}{12 – (-2)}$
$= \frac{517.50 – 500}{12 + 2}$
$= \frac{17.50}{14} = 1.25$ dollars per month.

(ii)
The linear estimate $A(t)$ uses the point $(12, 517.50)$ and slope $1.25$.
$A(20) = M(12) + 1.25(20 – 12)$
$A(20) = 517.50 + 1.25(8)$
$A(20) = 517.50 + 10 = 527.50$ dollars.

(iii)
The model $M(t)$ for $t \ge 0$ is an exponential function ($b > 1$), which is concave up.
The estimate $A(t)$ is a linear function (a secant line).
Since $M(t)$ is increasing at an increasing rate (exponential growth), the linear model will fall further behind the actual values as $t$ increases.

Part C

The model is only valid as long as the account is open.
Setting $M(t) = 565$ allows us to solve for the maximum value of $t$.
$500(1.035)^{(t/12)} = 565$
This value of $t$ serves as the upper bound (maximum) for the domain of the model $M$.

Question 

After Mr. Passwater missed a day of school, a rumor began to spread that he had won the Powerball lottery and moved to Japan. Initially, seven students knew about the rumor (they were the ones that started it!). After two hours (\(t=2\)), a total of 15 students had heard the rumor. After six hours (\(t=6\)), 67 students had heard the rumor.
The number of students that have heard the rumor can be modeled by the piecewise function \(R\) given by: $$R(t) = \begin{cases} 7(a)^{t/2} & \text{for } 0 \le t < 6 \\ -213.29 + b \ln t & \text{for } t \ge 6 \end{cases}$$ where \(R(t)\) is the number of students that have heard the rumor at time \(t\) hours since the rumor first began.

(A) (i) Use the given data to write two equations that can be used to find the values for constants \(a\) and \(b\) in the expression for \(R(t)\).
        (ii) Find the values for \(a\) and \(b\) as decimal approximations.

(B) (i) Use the given data to find the average rate of change in the number of students that have heard the rumor, in students per hour, from \(t=2\) to \(t=6\) hours. Express your answer as a decimal approximation. Show the computations that lead to your answer.
        (ii) Interpret the meaning of your answer from (i) in the context of the problem.
        (iii) Consider the values that result from using the average rate of change found in (i) to estimate the number of students that have heard the rumor for times \(t=p\) hours, where \(0 < p < 6\). Are these estimates less than or greater than the number of students predicted by the model \(R\) for times \(t=p\) hours? Explain your reasoning using characteristics of the average rate of change and characteristics of the model \(R\).

(C) The model \(R\) is valid for \(0 \le t \le 12\) hours. Explain how the range values of the function \(R\) should be limited by the context of the problem.
▶️ Answer/Explanation
Detailed solution

Part (A)

(i) Writing the equations:
We are given the following data points:
• At \(t=2\), \(R(2) = 15\).
• At \(t=6\), \(R(6) = 67\).

For \(t=2\), since \(0 \le 2 < 6\), we use the first part of the piecewise function: \(R(t) = 7(a)^{t/2}\).
$$15 = 7(a)^{2/2} \quad \Rightarrow \quad 15 = 7a^1$$
Equation 1: \(15 = 7a\)

For \(t=6\), since \(t \ge 6\), we use the second part of the piecewise function: \(R(t) = -213.29 + b \ln t\).
Equation 2: \(67 = -213.29 + b \ln(6)\)

(ii) Finding the values for \(a\) and \(b\):
From Equation 1:
$$a = \frac{15}{7} \approx 2.1428$$
From Equation 2:
$$67 + 213.29 = b \ln(6)$$
$$280.29 = b \ln(6)$$
$$b = \frac{280.29}{\ln(6)} \approx \frac{280.29}{1.79176} \approx 156.4328$$
Answer: \(a \approx 2.143\), \(b \approx 156.433\)

Part (B)

(i) Average Rate of Change:
The formula for the average rate of change from \(t=2\) to \(t=6\) is:
$$\text{Avg Rate} = \frac{R(6) – R(2)}{6 – 2}$$
Substituting the given values (\(R(6)=67\) and \(R(2)=15\)):
$$\text{Avg Rate} = \frac{67 – 15}{4} = \frac{52}{4} = 13$$
Answer: 13 students per hour.

(ii) Interpretation:
On average, the number of students who have heard the rumor increases by 13 students per hour between the 2nd hour and the 6th hour.

(iii) Estimates vs. Model Prediction:
Answer: The estimates are greater than the number of students predicted by the model.
Reasoning:
• On the interval \(0 < t < 6\), the function \(R(t) = 7(a)^{t/2}\) is an exponential growth function with a base greater than 1.
• Exponential growth functions are concave up (the rate of change is increasing).
• The average rate of change corresponds to the slope of the secant line connecting the points at \(t=2\) and \(t=6\).
• For a concave up curve, the secant line lies above the curve on the interval between the two points. Therefore, linear estimates based on the average rate (secant line) will be greater than the actual function values.

Part (C)

Explanation:
The range values (outputs) of \(R(t)\) represent the number of students. In the context of the problem, this range must be limited in two ways:
1. Population Cap: The number of students who heard the rumor cannot exceed the total student population of the school.
2. Discrete Values: You cannot have a fraction of a student, so strictly speaking, the context implies the range should consist of whole numbers (non-negative integers).

Question 

A market analyst working for a small appliance manufacturer finds that if the firm produces and sells \(x\) blenders annually, the total profit (in dollars) is \(P(x) = -0.0013x^3 + 0.3507x^2 – 0.4591x – 421.888\). (4 marks each part)
a. Use a graphing device to help graph the polynomial function \(P\).
b. Find the average rate of change of \(P\) between two relative (local) extrema when \(0 < x < 200\).
c. Find the equation of the secant line of the graph of \(P\) between the two points in part b.
d. The inflection point of a function is the point on the graph where the graph changes concavity. Find out the inflection point of the graph of \(P\).
e. How will the rate of change vary before and after the inflection point?
▶️ Answer/Explanation
Detailed solution

a. Graphing the function
Using a graphing utility for \(P(x) = -0.0013x^3 + 0.3507x^2 – 0.4591x – 421.888\) on the interval \([0, 200]\) reveals a cubic curve shape.
The graph starts with a slight dip to a local minimum near \(x=0\), then rises steeply to a local maximum near \(x=180\), before falling again.

b. Average rate of change between extrema
First, find the derivative: \(P'(x) = -0.0039x^2 + 0.7014x – 0.4591\).
Set \(P'(x) = 0\) and use the quadratic formula to find the extrema: \(x \approx 0.66\) (local min) and \(x \approx 179.19\) (local max).
Calculate the profit at these points: \(P(0.66) \approx -422.04\) and \(P(179.19) \approx 3276.57\).
The average rate of change is: \(\frac{3276.57 – (-422.04)}{179.19 – 0.66} = \frac{3698.61}{178.53} \approx 20.72\).

c. Equation of the secant line
The slope \(m\) was found in part (b) to be approximately \(20.72\).
Using the point-slope form \(y – y_1 = m(x – x_1)\) with the minimum point \((0.66, -422.04)\):
\(y – (-422.04) = 20.72(x – 0.66)\)
\(y = 20.72x – 13.68 – 422.04\)
The equation is approximately \(y = 20.72x – 435.72\).

d. Inflection point
Find the second derivative: \(P”(x) = -0.0078x + 0.7014\).
Set \(P”(x) = 0\) to find the change in concavity: \(0 = -0.0078x + 0.7014 \Rightarrow x = \frac{0.7014}{0.0078} \approx 89.92\).
Find the corresponding y-value: \(P(89.92) \approx 1427.27\).
The inflection point is approximately \((89.92, 1427.27)\).

e. Variation of rate of change
The rate of change is represented by the derivative, \(P'(x)\).
Before the inflection point (\(x < 89.92\)), the graph is concave up (\(P”(x) > 0\)), so the rate of change is increasing.
After the inflection point (\(x > 89.92\)), the graph is concave down (\(P”(x) < 0\)), so the rate of change is decreasing.

Question 

The Chinese bamboo tree exhibits a unique growth pattern. Once a seed has been planted, the Chinese bamboo tree does not break through the ground for several years. However, once it breaks through the ground, the Chinese bamboo tree grows exponentially. In one particular experiment, a group of biologists recorded the height of a Chinese bamboo tree once it broke through the ground. After one week (\(t = 1\)), the Chinese bamboo tree measured 3 feet, and after five weeks (\(t = 5\)), the same tree measured 89 feet.
The height of the Chinese bamboo tree can be modeled by the function \(H\) given by \(H(t) = ab^x\), where \(H(t)\) is the height of the tree, in feet, \(t\) weeks after it first breaks ground.
(A) (i) Use the given data to write two equations that can be used to find the values for constants \(a\) and \(b\) in the expression for \(H(t)\).
(ii) Find the values for \(a\) and \(b\).
(B) (i) Use the given data to find the average rate of change of the height of the Chinese bamboo tree, in feet per week, from \(t = 1\) to \(t = 5\) weeks. Express your answer as a decimal approximation. Show the computations that lead to your answer.
(ii) Interpret the meaning of your answer from (i) in the context of the problem.
(iii) Consider the average rates of change of \(H\) from \(t = 5\) to \(t = p\) weeks, where \(p > 5\). Are these average rates of change less than or greater than the average rate of change from \(t = 1\) to \(t = 5\) weeks found in (i)? Explain your reasoning.
(C) For which \(t\)-value, \(t = 4\) weeks or \(t = 11\) weeks, should the biologists have more confidence in when using the model \(H\)? Give a reason for your answer in the context of the problem.
▶️ Answer/Explanation
Detailed solution

(A)(i) Equations
Substituting the points \((1, 3)\) and \((5, 89)\) into \(H(t) = ab^t\):
1. \(3 = ab^1\) (or \(3 = ab\))
2. \(89 = ab^5\)

(A)(ii) Values for a and b
Dividing equation 2 by equation 1: \(\frac{ab^5}{ab} = \frac{89}{3} \implies b^4 = 29.67\).
Solving for \(b\): \(b = (29.67)^{0.25} \approx 2.33\).
Solving for \(a\): \(a = \frac{3}{2.33} \approx 1.29\).

(B)(i) Average Rate of Change
\(\text{Rate} = \frac{H(5) – H(1)}{5 – 1} = \frac{89 – 3}{4} = \frac{86}{4} = 21.5\)
Answer: 21.5 feet per week.

(B)(ii) Interpretation
The answer indicates that between the first and fifth weeks, the bamboo tree grew at an average speed of 21.5 feet per week.

(B)(iii) Comparison
Greater. The function represents exponential growth (\(b > 1\)), which is concave up. This means the rate of growth increases over time, so the rate after week 5 will be steeper than the rate before week 5.

(C) Confidence
\(t = 4\) weeks.
The biologists should be more confident in \(t=4\) because it is an interpolation (within the observed data range). \(t=11\) is an extrapolation; biological growth cannot remain exponential indefinitely, so the model is likely inaccurate that far out.

Scroll to Top