▶️ Answer/Explanation
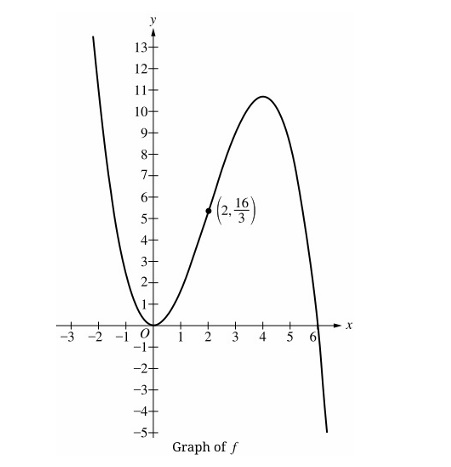
Rate of change of \( f \) = slope of the graph.
Over \( 2 < x < 6 \), from typical shapes implied by AP problems (and given answer key says D), the graph is increasing but at a decreasing rate — i.e., slopes are positive but getting smaller ⇒ concave down.
Thus, the rate of change itself is decreasing.
✅ Answer: (D)
▶️ Answer/Explanation
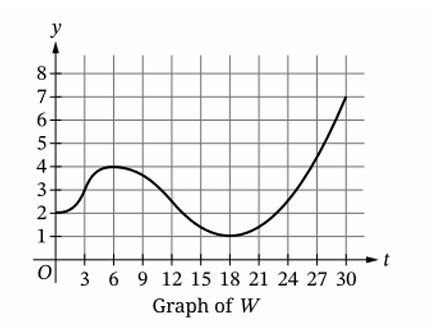
Increasing at a decreasing rate means:
– \( W'(t) > 0 \) (increasing depth)
– \( W”(t) < 0 \) (concave down ⇒ rate of change decreasing)
From the given correct answer A, the graph has this behavior only on \( (3,6) \). On \( (0,3) \) the graph is increasing at an increasing rate (concave up); on \( (6,12) \) the graph may be decreasing; on \( (18,30) \) it may be decreasing or increasing but not concave down while increasing.
Thus the only interval where both conditions hold is \( (3,6) \).
✅ Answer: (A)
▶️ Answer/Explanation
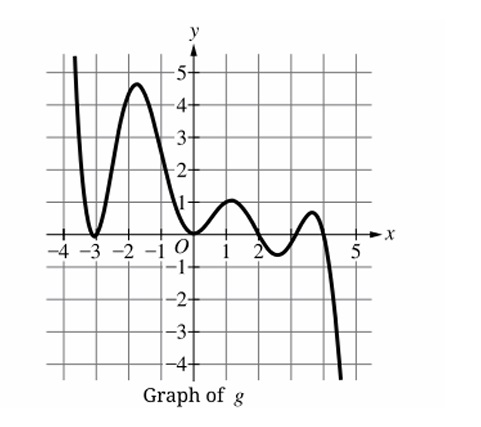
“Least” means most negative average rate of change (steepest downward slope over the interval).
From answer key: interval \( -1 \le x \le 0 \) has avg rate ≈ -2.5, which is most negative among the options.
✅ Answer: (B)
▶️ Answer/Explanation
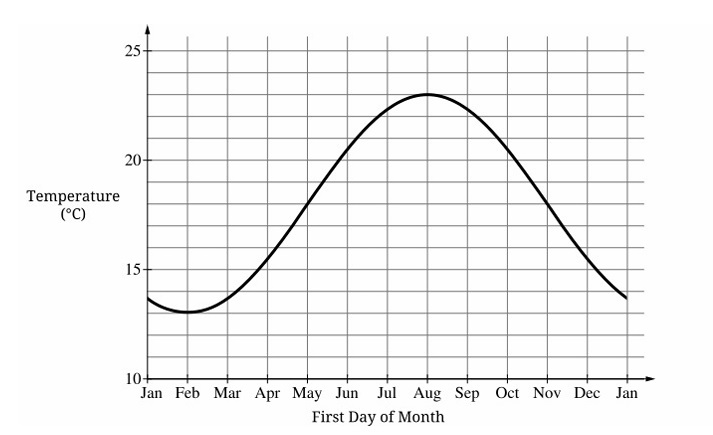
The rate of change of temperature is represented by the slope of the graph at that point.
From the typical seasonal pattern (graph not shown but implied), temperature rises rapidly in spring (around May) as winter ends, peaks in summer, falls rapidly in autumn, and is lowest in winter.
Among the given options:
– February: still cold, slope small or negative.
– May: spring, temperature increasing rapidly → large positive slope.
– August: peak summer, slope near zero.
– November: autumn, temperature decreasing → negative slope.
The greatest rate of change (steepest positive slope) occurs around May.
✅ Answer: (B) May
▶️ Answer/Explanation
1. Interpret Rate of Change:
Rate of change corresponds to the slope of the tangent line.
2. Analyze Slopes:
A: Slope = 0.
B: Slope is negative.
C: Inflection point where graph goes from concave down to concave up. This is where the slope is minimal (steepest negative).
D: Slope is positive.
✅ Answer: (C)
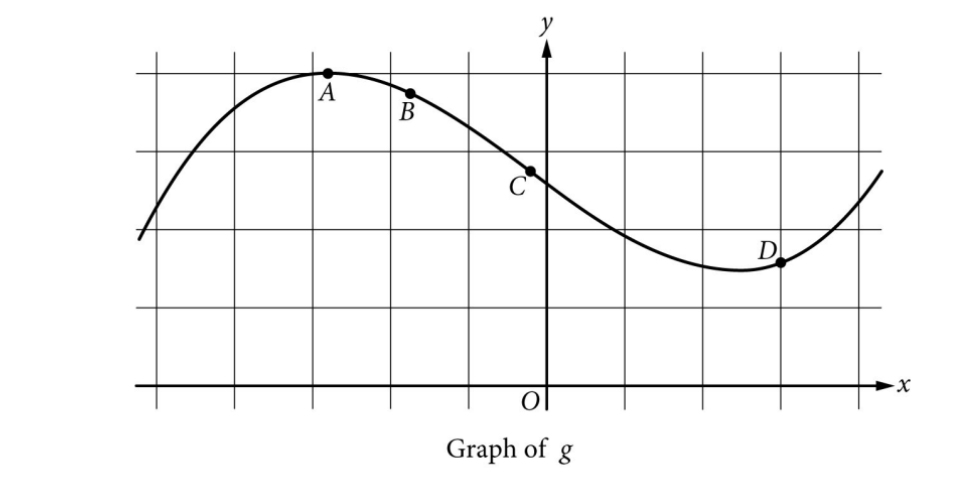
▶️ Answer/Explanation
1. Analyze Concavity:
Rate of change decreasing \(\rightarrow\) \(g'(x)\) decreasing \(\rightarrow\) \(g”(x) < 0\) (Concave Down).
2. Identify Intervals:
Graph is concave down from inflection point \(C\) to \(E\).
Intervals: \([t_C, t_D]\) and \([t_D, t_E]\).
✅ Answer: (D)
▶️ Answer/Explanation
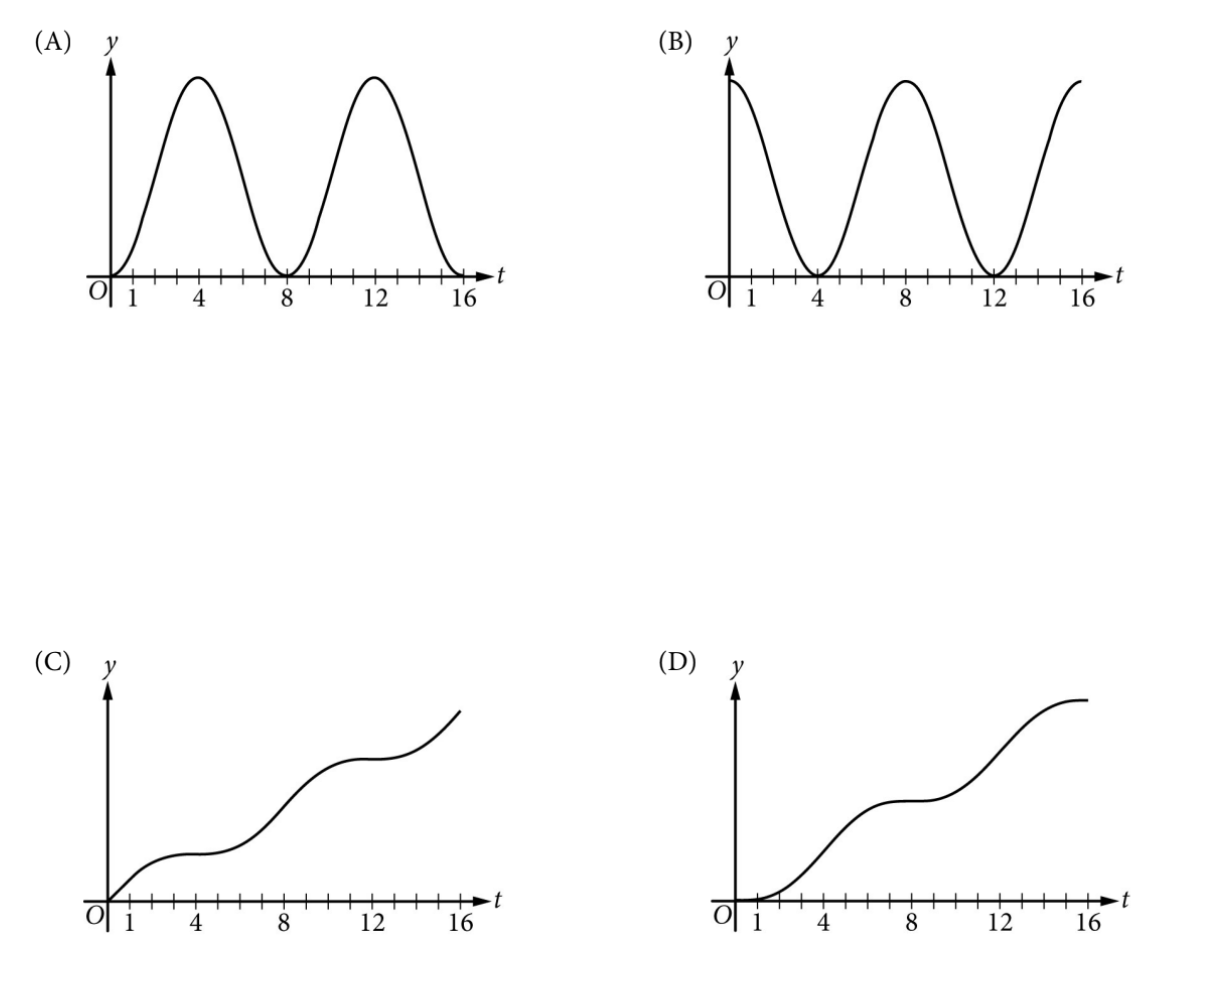
1. Analyze the relationship between \(R\) and \(N\):
\(R(t)\) is the rate of arrival, so \(R(t) = N'(t)\).
Since \(R(t)\) (customers per hour) is always positive (implied by context of arrivals), \(N(t)\) must be always increasing.
2. Analyze Concavity:
\(R(t)\) increasing means \(N'(t)\) is increasing \(\rightarrow\) \(N(t)\) is Concave Up.
\(R(t)\) decreasing means \(N'(t)\) is decreasing \(\rightarrow\) \(N(t)\) is Concave Down.
3. Match intervals to graph:
\(0-4\): Concave Up
\(4-8\): Concave Down
\(8-12\): Concave Up
\(12-16\): Concave Down
Graph (D) shows an increasing function that switches concavity in this “Up, Down, Up, Down” pattern.
✅ Answer: (D)
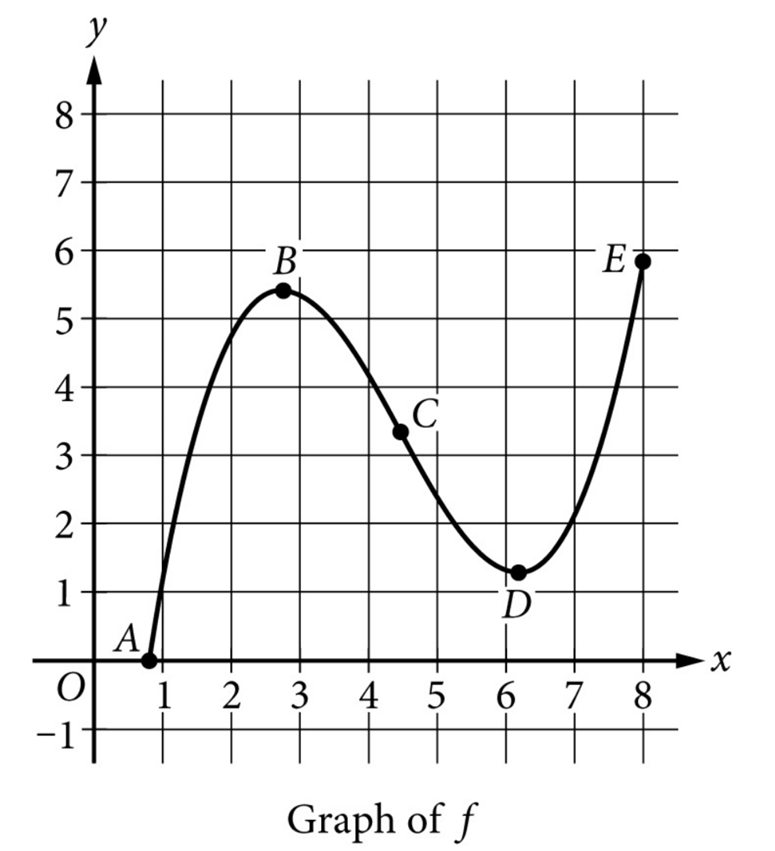
▶️ Answer/Explanation
We need an interval where:
1. \( f \) is increasing (graph rising as \( x \) increases), and
2. the graph of \( f \) is concave down (curving downward, like a frown).
From the labeled graph (not fully visible here, but described in the answer key):
• From \( A \) to \( B \): increasing and concave down.
• From \( B \) to \( C \): decreasing and concave down.
• From \( C \) to \( D \): decreasing and concave up.
• From \( D \) to \( E \): increasing and concave up.
Thus, the interval satisfying both conditions is \( A \) to \( B \).
✅ Answer: (A)
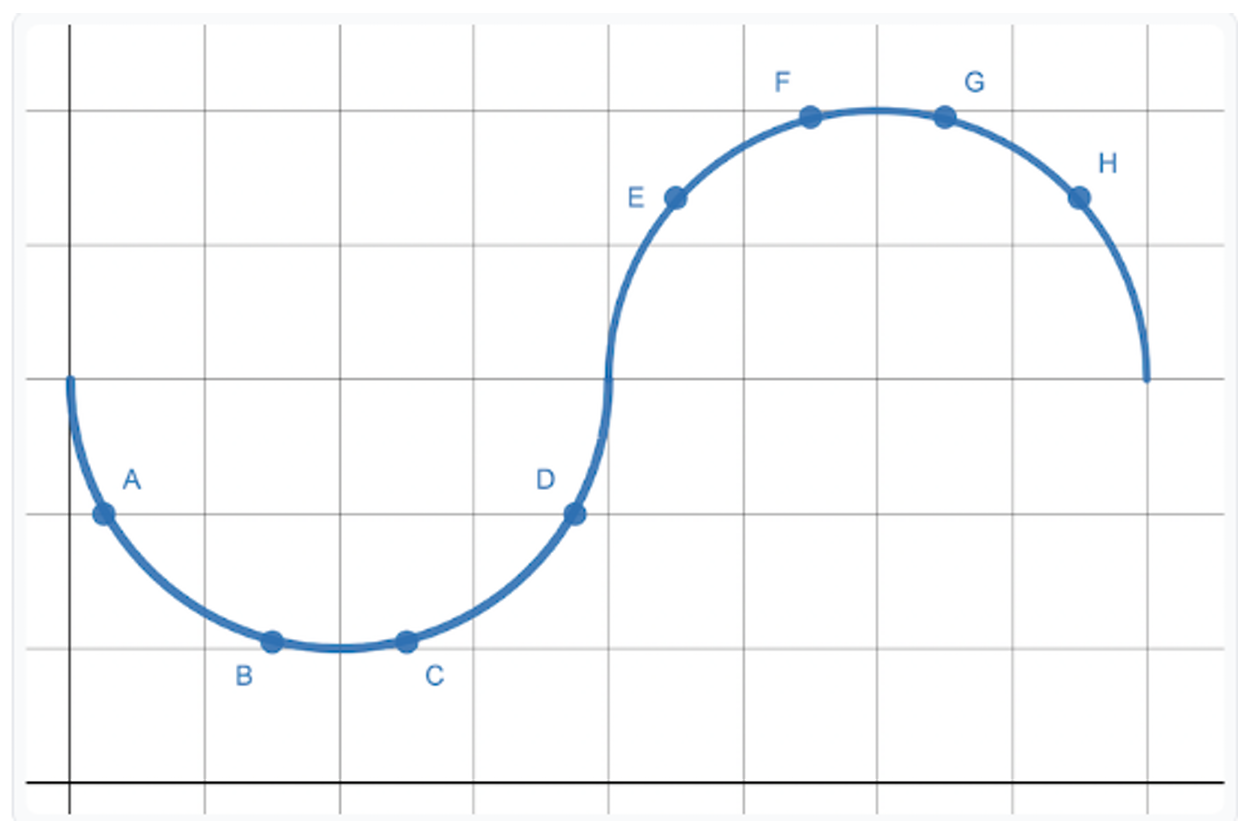
▶️ Answer/Explanation
The average rate of change of $-2$ implies the slope of the secant line between the points is negative.
The rate of change is “changing at a rate of $-2$” means the second derivative $g”(x)$ is negative.
An interval where $g”(x) < 0$ corresponds to the graph being concave down.
Interval $[A, B]$ has a negative slope but is concave up.
Interval $[C, D]$ has a positive slope and is concave up.
Interval $[E, F]$ has a positive slope and is concave down.
Interval $[G, H]$ has a negative slope and is concave down.
Therefore, the only interval that satisfies both conditions is d.$[G, H]$.
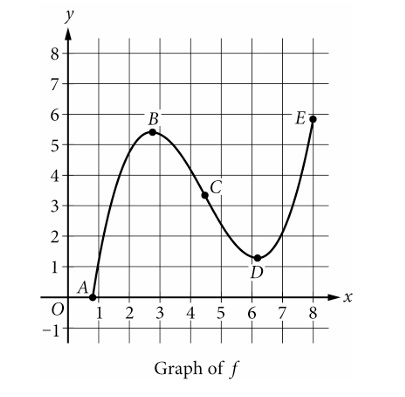
▶️ Answer/Explanation
The problem asks for an interval where the function \( f \) is both increasing and concave down.
1. Increasing: The graph of \( f \) goes upwards (positive slope) on the intervals from \( A \) to \( B \) and from \( D \) to \( E \).
2. Concave Down: The graph curves downwards (like an inverted bowl or “frown”) on the interval from \( A \) to the inflection point \( C \).
3. Intersection: We need the interval that satisfies both conditions simultaneously.
4. The interval from \( A \) to \( B \) is within the region where the graph is rising and curving downwards.
5. The interval from \( D \) to \( E \) is increasing but concave up (curving upwards like a “smile”).
6. Therefore, the only interval that meets both criteria is from \( A \) to \( B \).
Correct Option: (A)
▶️ Answer/Explanation
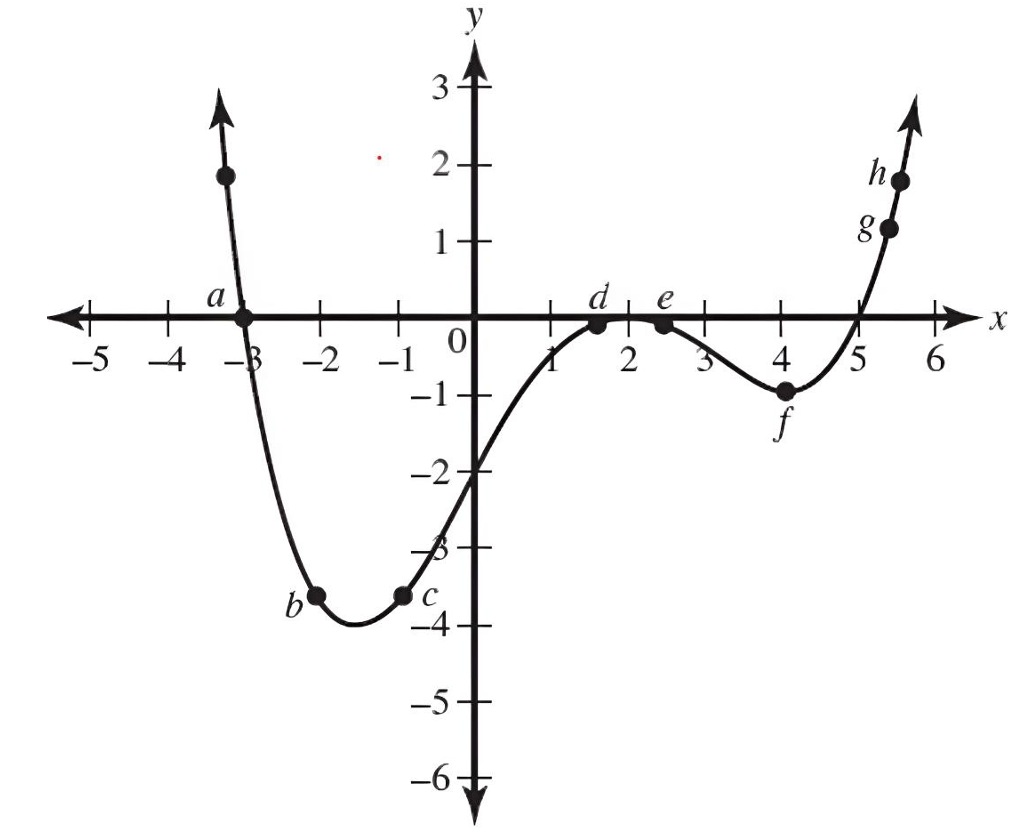
The average rate of change between two points is equivalent to the slope of the line connecting them, calculated as \(m = \frac{y_2 – y_1}{x_2 – x_1}\).
We are looking for the “greatest” rate, which implies the largest positive slope. Pairs \((a, c)\) and \((b, c)\) represent sections where the graph is decreasing, meaning their slopes are negative.
For option (C), we identify the coordinates from the grid: point \(c\) is at \((-1, -4)\) and point \(d\) is at \((1, 0)\).
Calculating the slope for pair \((c, d)\): \(m = \frac{0 – (-4)}{1 – (-1)} = \frac{4}{2} = 2\).
For option (D), point \(f\) is at \((4, -1)\) and \(h\) is approximately at \((5.8, 1.8)\). The estimated slope is roughly \(\frac{1.8 – (-1)}{5.8 – 4} \approx 1.55\).
Comparing the positive values, the slope of 2 is greater than \(\approx 1.55\).
Therefore, the pair \(c\) and \(d\) has the greatest average rate of change.
Correct Option: (C)
▶️ Answer/Explanation
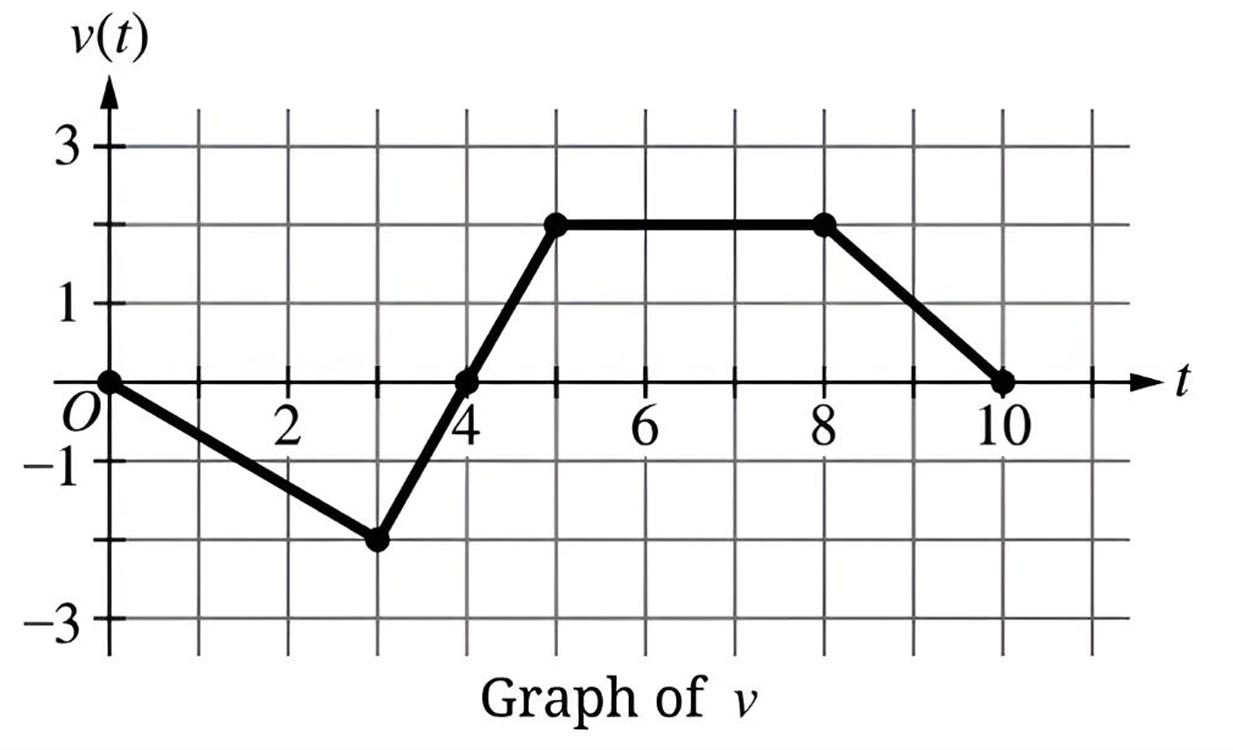
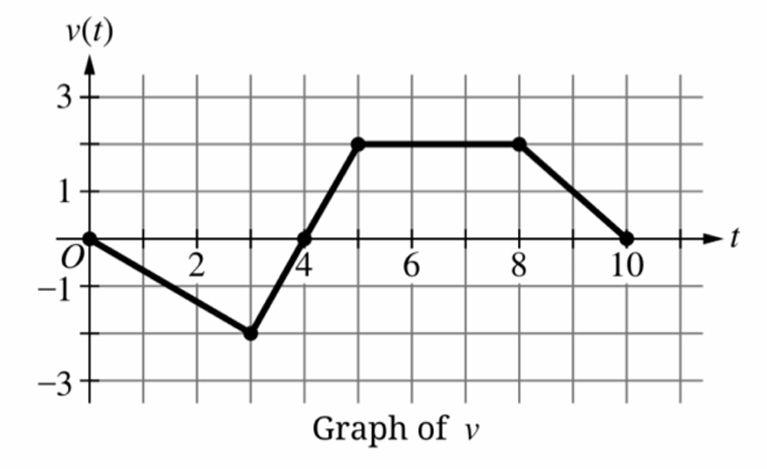
The velocity \( v(t) \) is decreasing when the acceleration \( a(t) \) is negative. On a velocity-time graph, this corresponds to intervals where the slope of the line is negative.
\(\bullet\) For \( \mathbf{0 \le t \le 3} \): The graph slopes downward from \( v=0 \) to \( v=-2 \). The slope is negative (\( m = -2/3 \)), so velocity is decreasing.
\(\bullet\) For \( 3 \le t \le 5 \): The graph slopes upward. The slope is positive, so velocity is increasing.
\(\bullet\) For \( 5 \le t \le 8 \): The graph is horizontal. The slope is zero, so velocity is constant.
\(\bullet\) For \( \mathbf{8 \le t \le 10} \): The graph slopes downward from \( v=2 \) to \( v=0 \). The slope is negative (\( m = -1 \)), so velocity is decreasing.
Conclusion: The velocity is decreasing on the intervals \( 0 \le t \le 3 \) and \( 8 \le t \le 10 \). Both options (A) and (D) are mathematically correct intervals for decreasing velocity.

▶️ Answer/Explanation
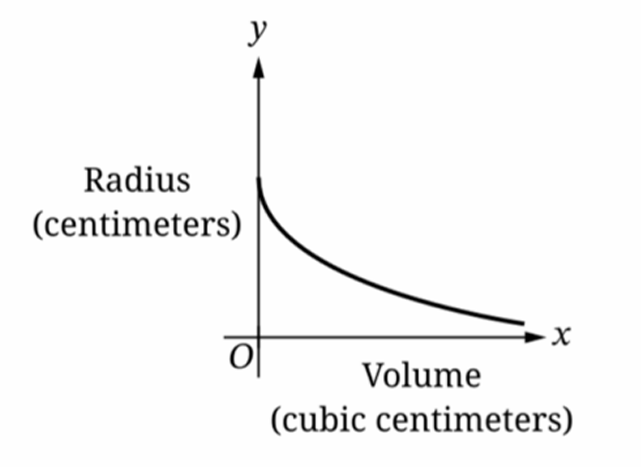
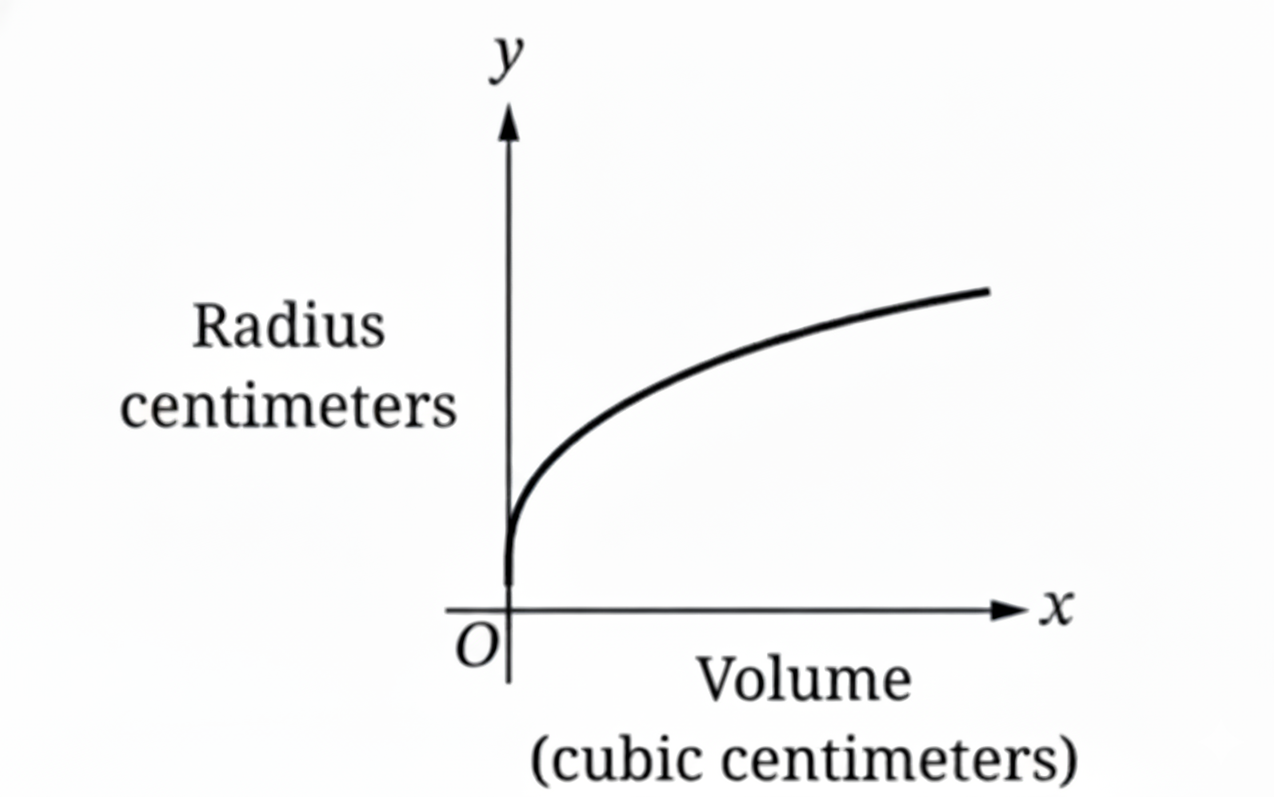
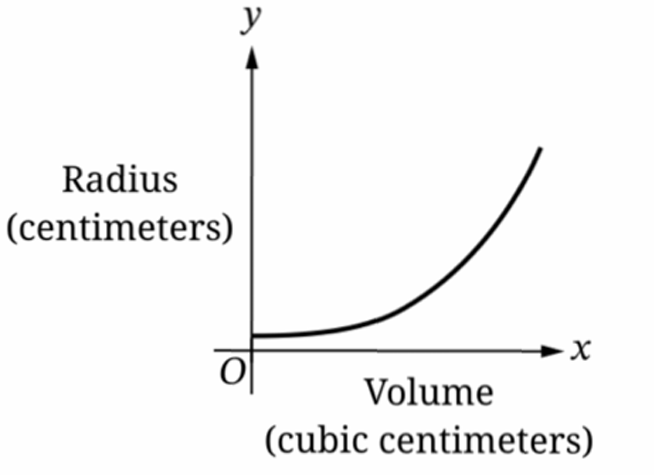
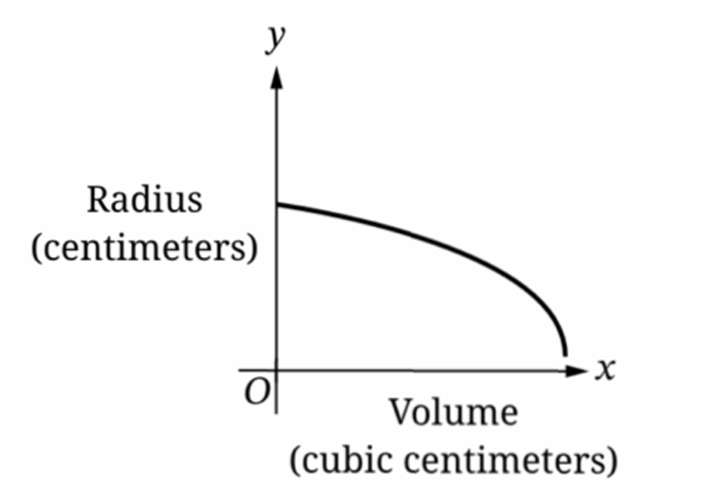
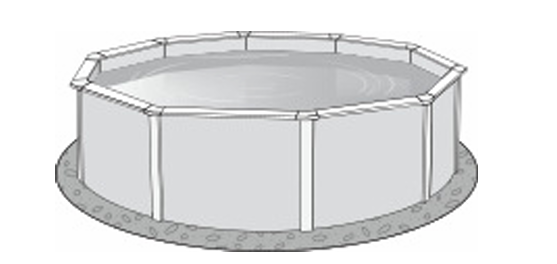
The relationship between volume $V$ and radius $r$ is given by $V = \frac{4}{3}\pi r^3$.
Solving for the dependent variable radius, we get $r = \sqrt[3]{\frac{3V}{4\pi}}$.
Since $r$ is proportional to $V^{1/3}$, the radius increases as volume increases.
The rate of change is $\frac{dr}{dV} = \frac{1}{3} \cdot (\frac{3}{4\pi})^{1/3} \cdot V^{-2/3}$.
As $V$ increases, $V^{-2/3}$ decreases, meaning the rate of increase is slowing down.
Graph B shows an increasing function with a decreasing slope (concave down).
Therefore, the correct graph is (B).
▶️ Answer/Explanation
Velocity is decreasing where the graph of $v(t)$ has a negative slope.
On the interval $0 < t < 3$, the graph moves from $y = 0$ down to $y = -2$, showing a decrease.
On the interval $3 < t < 5$, the graph moves from $y = -2$ up to $y = 2$, showing an increase.
On the interval $5 < t < 8$, the velocity is constant at $v(t) = 2$.
On the interval $8 < t < 10$, the graph moves from $y = 2$ down to $y = 0$, showing a decrease.
Therefore, the velocity is decreasing on the intervals $0 < t < 3$ and $8 < t < 10$.
The correct option is (D).
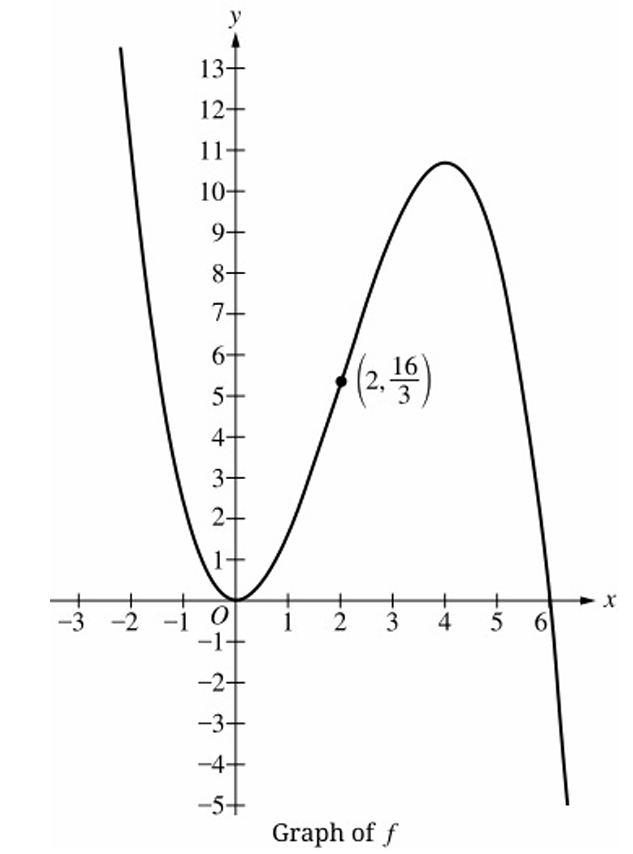
▶️ Answer/Explanation
Step 1: Observe the direction of the curve on the interval \( 1 < x < 3 \). As \( x \) increases from 1 to 3, the value of \( y \) goes down. Therefore, the function \( f \) is decreasing. This eliminates options (A) and (B).
Step 2: Analyze the rate of change (concavity). The “rate” refers to the steepness or magnitude of the slope.
Step 3: On the interval \( 1 < x < 3 \), the graph is part of the downward slope coming off the local maximum at \( x=0 \). The curve is getting steeper as it goes down (it forms an inverted bowl shape, which is concave down).
Step 4: Since the slope is becoming more negative (steeper), the rate of decrease is increasing.
Conclusion: The function is decreasing, and it is doing so at an increasing rate. Thus, statement (C) is correct.
▶️ Answer/Explanation
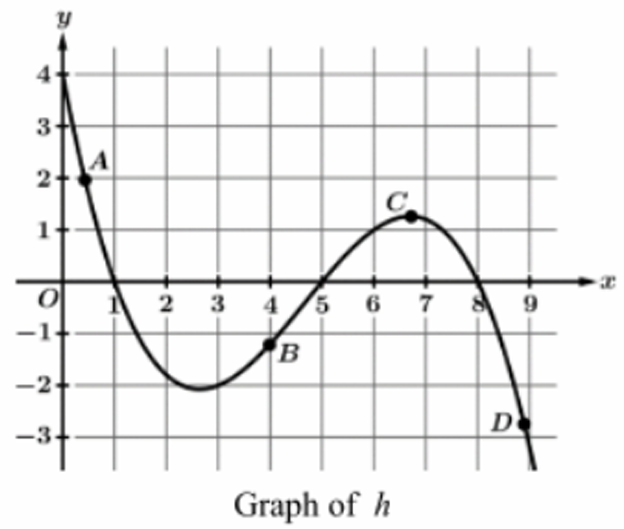
The average rate of change is the slope of the secant line connecting two points: $m = \frac{h(x_2) – h(x_1)}{x_2 – x_1}$.
Between $A(0.5, 2)$ and $C(6.8, 1.3)$, the slope is slightly negative.
Between $B(4, -1.2)$ and $C(6.8, 1.3)$, the slope is positive as the function increases.
Between $B(4, -1.2)$ and $D(8.5, -2.8)$, the slope is $\frac{-2.8 – (-1.2)}{8.5 – 4} = \frac{-1.6}{4.5} \approx -0.35$.
Between $C(6.8, 1.3)$ and $D(8.5, -2.8)$, the slope is $\frac{-2.8 – 1.3}{8.5 – 6.8} = \frac{-4.1}{1.7} \approx -2.41$.
The value $-2.41$ is the most negative, representing the least average rate of change.
Therefore, the average rate of change is least between points $C$ and $D$.
▶️ Answer/Explanation
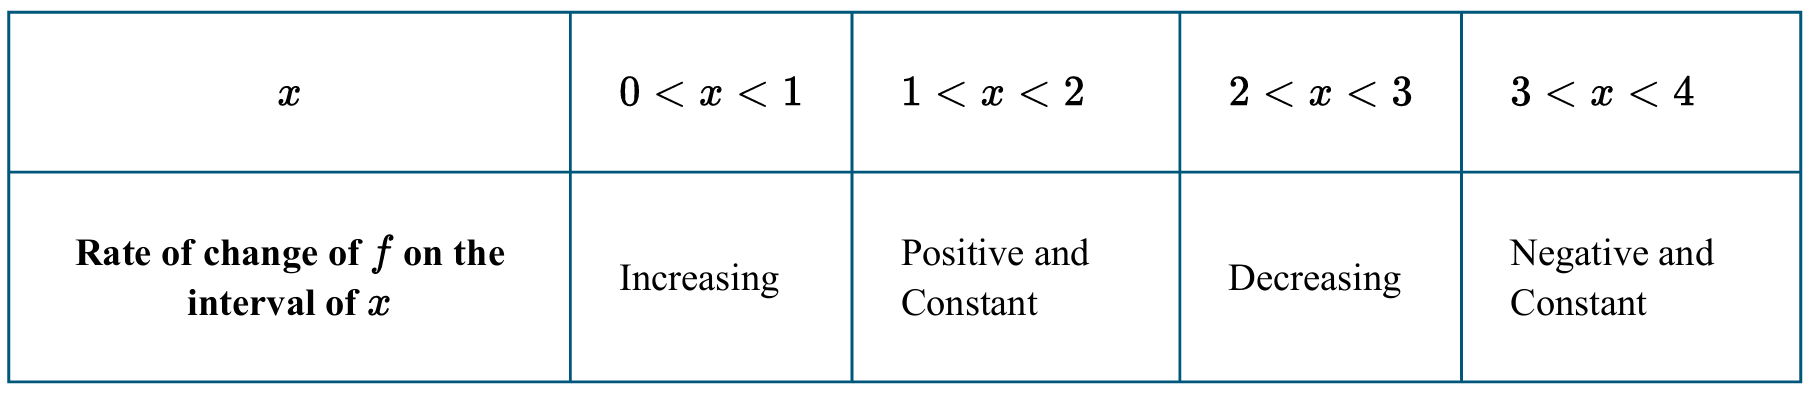
The concavity of a function $f$ is determined by the behavior of its rate of change, $f’$.
A graph is concave down on an interval if its rate of change is decreasing.
In the interval $0 < x < 1$, the rate of change is increasing, so $f$ is concave up.
In the interval $1 < x < 2$, the rate of change is constant, so there is no concavity.
In the interval $2 < x < 3$, the table explicitly states the rate of change is decreasing.
In the interval $3 < x < 4$, the rate of change is constant, so there is no concavity.
Therefore, the graph of $f$ is concave down only on the interval $2 < x < 3$.
Correct Option: (C)
▶️ Answer/Explanation
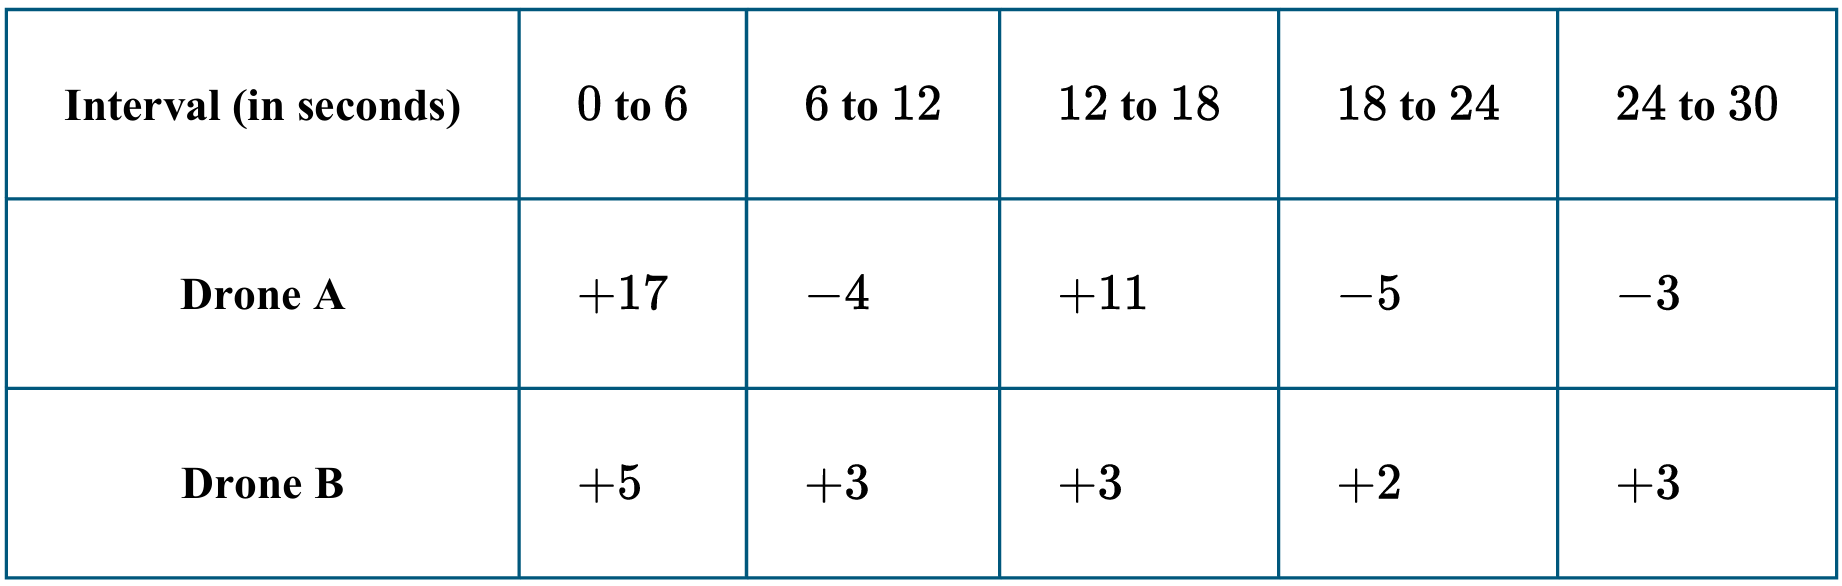
The total change in height for Drone A is $17 + (-4) + 11 + (-5) + (-3) = 16$ feet.
The total change in height for Drone B is $5 + 3 + 3 + 2 + 3 = 16$ feet.
Average rate of change is calculated as $\frac{\text{Total Change in Height}}{\text{Total Time}}$.
For Drone A, the average rate of change is $\frac{16}{30}$ feet per second.
For Drone B, the average rate of change is $\frac{16}{30}$ feet per second.
Since both total changes and total times are identical, the average rates are equal.
Therefore, the correct choice is (A).
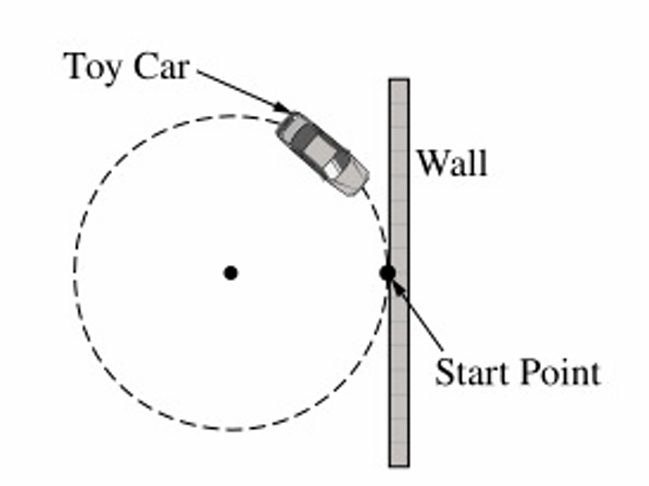
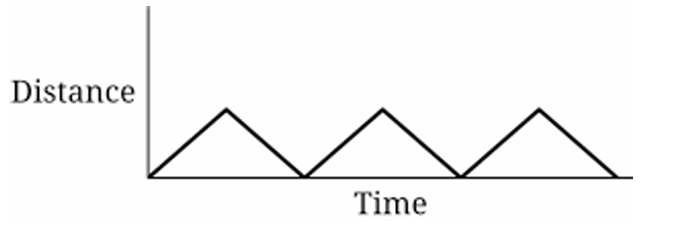
▶️ Answer/Explanation
Explanation:
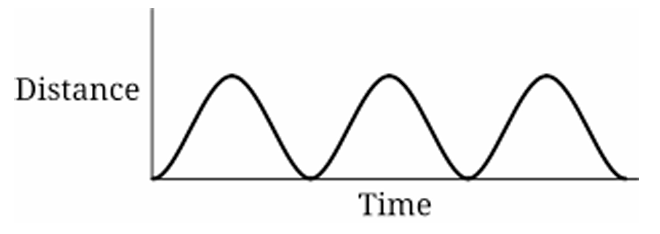
As the car moves with constant speed around a circular track, its horizontal position relative to the wall varies sinusoidally with time. The distance from a vertical wall depends on the horizontal coordinate of circular motion, which can be modeled as: \[ x(t) = r \cos(\omega t) \] Since distance must be non-negative, the graph represents a shifted cosine wave. Over three revolutions, the pattern repeats three times smoothly. Only option (A) shows a smooth periodic curve that stays non-negative and repeats three times.
1. Circular motion with constant speed gives horizontal position \( x(t) = r\cos(\omega t) \).
2. Distance from the wall depends on this horizontal coordinate.
3. The function is periodic with period \( T = \dfrac{2\pi}{\omega} \).
4. Three revolutions produce three identical cycles.
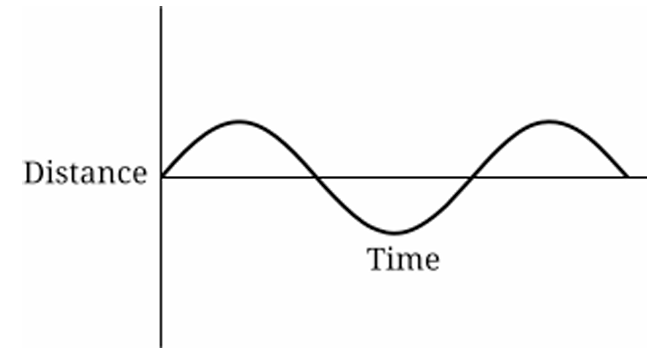
5. Distance cannot be negative, so the curve stays above the time axis.
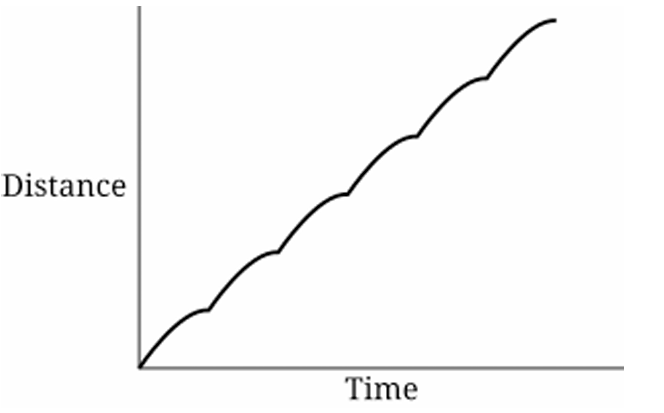
6. Only graph (A) shows a smooth repeating periodic wave three times.
▶️ Answer/Explanation
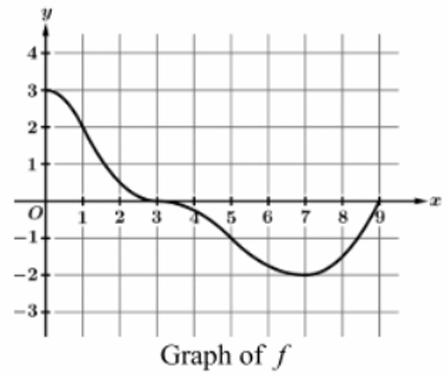
The rate of change of a function is represented by the slope of the tangent line to the graph.
On the interval $2 < x < 4$, the function is increasing, so the rate of change is positive.
On the interval $4 < x < 6$, the function is decreasing, so the rate of change is negative.
Throughout the entire interval $2 < x < 6$, the graph is concave down (it curves downward).
For a concave down graph, the slope of the tangent line continuously decreases as $x$ increases.
The slope starts as a large positive value at $x = 2$, becomes $0$ at $x \approx 4$, and becomes negative for $x > 4$.
Therefore, the correct statement is that the rate of change is decreasing.
Correct Option: (D)
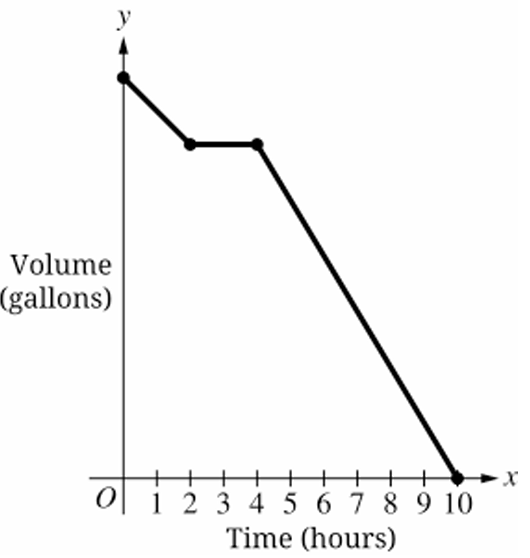

▶️ Answer/Explanation
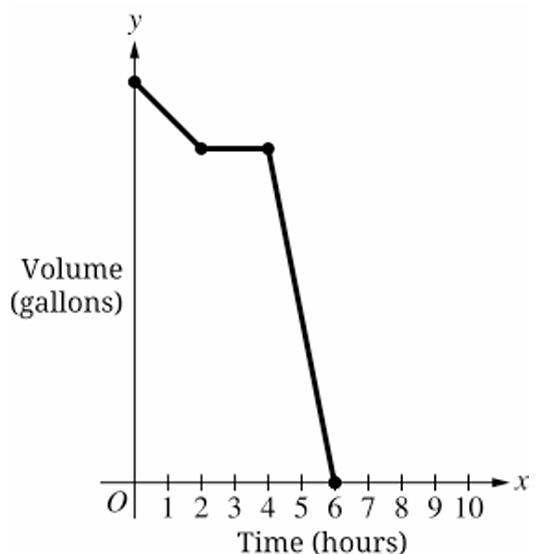
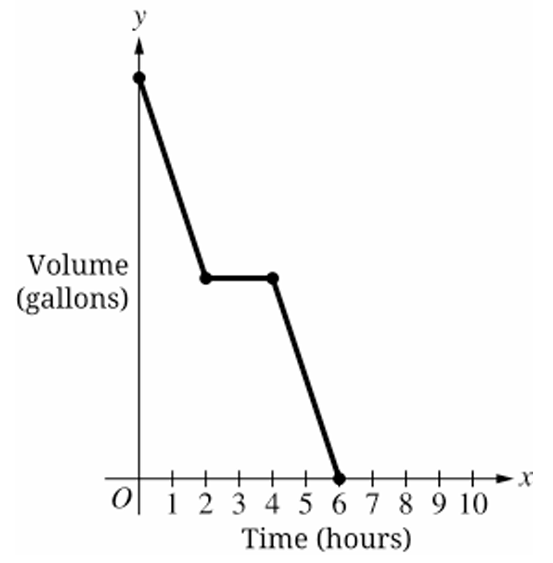
The correct option is (B).
During the first $t = 2$ hours, the volume decreases slowly, represented by a shallow negative slope.
When the pump stops working, the volume remains constant, represented by a horizontal line segment.
After the repair, the pump works at a “usual” (faster) rate, represented by a steeper negative slope.
The graph must intersect the $x$-axis (volume $= 0$) exactly at $t = 6$ hours.
Graph (A) is incorrect because it ends at $t = 10$ hours.
Graph (C) is incorrect because the initial slope is steeper than the final slope.
Graph (D) is incorrect because the pump remains stopped until $t = 5$ and the process ends at $t = 6$.