▶️ Answer/Explanation
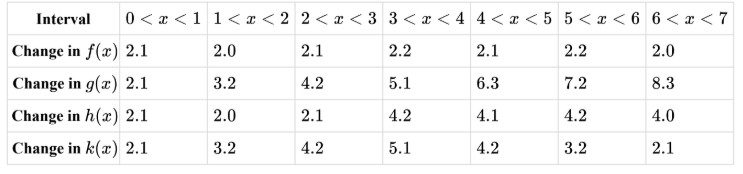
For a piecewise-linear function with two linear segments, the average rate of change should be roughly constant in each segment but different between segments.
- \( f \): rates ~constant ⇒ one linear function, not two segments.
- \( g \): rates increase steadily ⇒ curved, not piecewise-linear.
- \( h \): rates ~2.1 for intervals 1–3 (0<x<3), then ~4.2 for intervals 4–7 (3<x<7) ⇒ two different constant slopes ⇒ piecewise-linear with two segments.
- \( k \): rates increase then decrease ⇒ not constant in two blocks.
✅ Answer: (C)
▶️ Answer/Explanation
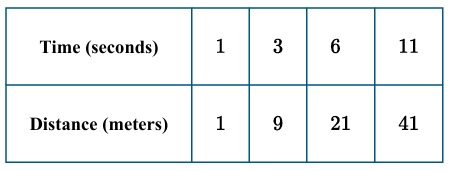
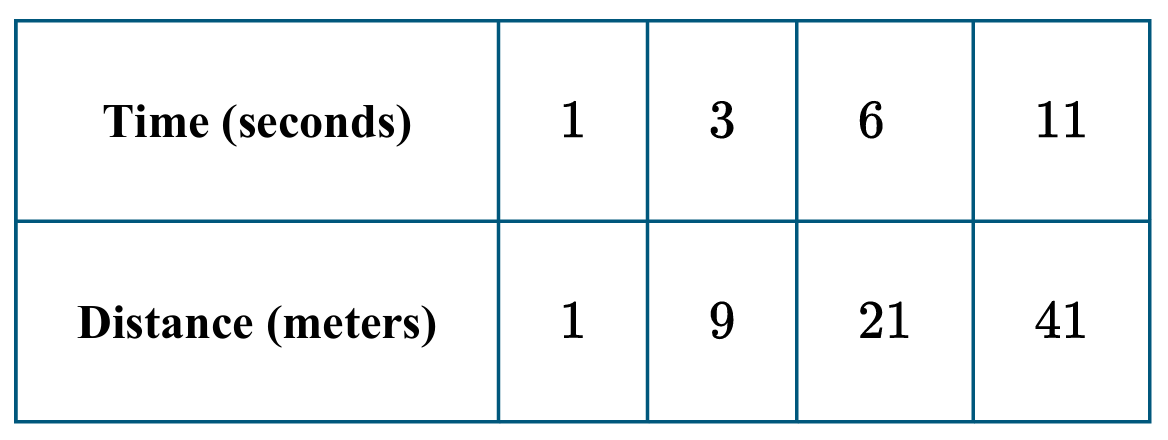
Calculate the average rate of change (speed) over each time interval:
From \( t=1 \) to \( t=3 \): \( \frac{9-1}{3-1} = \frac{8}{2} = 4 \) m/s
From \( t=3 \) to \( t=6 \): \( \frac{21-9}{6-3} = \frac{12}{3} = 4 \) m/s
From \( t=6 \) to \( t=11 \): \( \frac{41-21}{11-6} = \frac{20}{5} = 4 \) m/s
The speed is constant at 4 m/s, so the acceleration (rate of change of speed) is 0 m/s².
Therefore, the rate of change of the rates of change is \( 0 \) m/s², and the object moves with constant speed (neither speeding up nor slowing down).
✅ Answer: (B)
▶️ Answer/Explanation
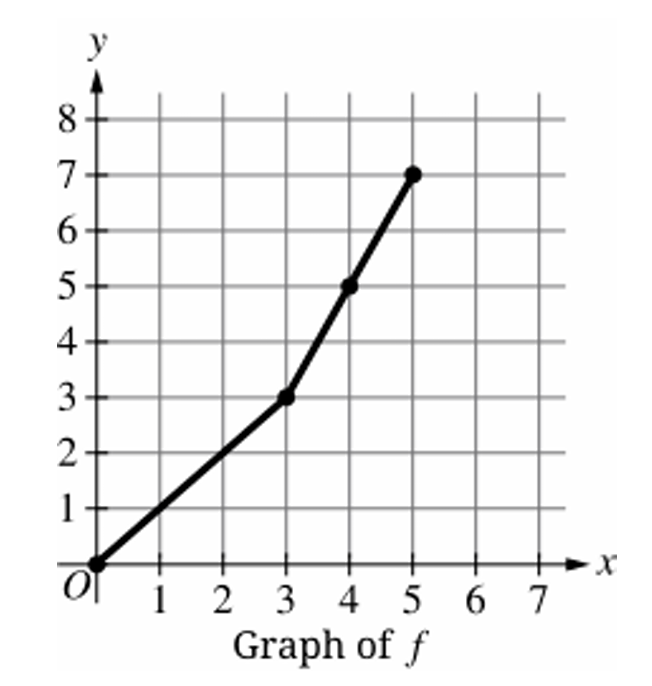
The function $g$ is defined as the inverse of $f$, meaning $g = f^{-1}$.
By the property of inverse functions, the range of $f$ becomes the domain of $g$.
Similarly, the domain of $f$ becomes the range of $g$.
The maximum value of $g$ is the maximum value in its range, which is the maximum $x$-value of $f$.
Looking at the provided graph, the function $f$ is defined on the interval $x \in [0, 5]$.
The largest $x$-coordinate reached by the graph of $f$ is $5$.
Therefore, the maximum value of the inverse function $g$ is $5$.
The correct option is (C).
▶️ Answer/Explanation
The correct option is (D).
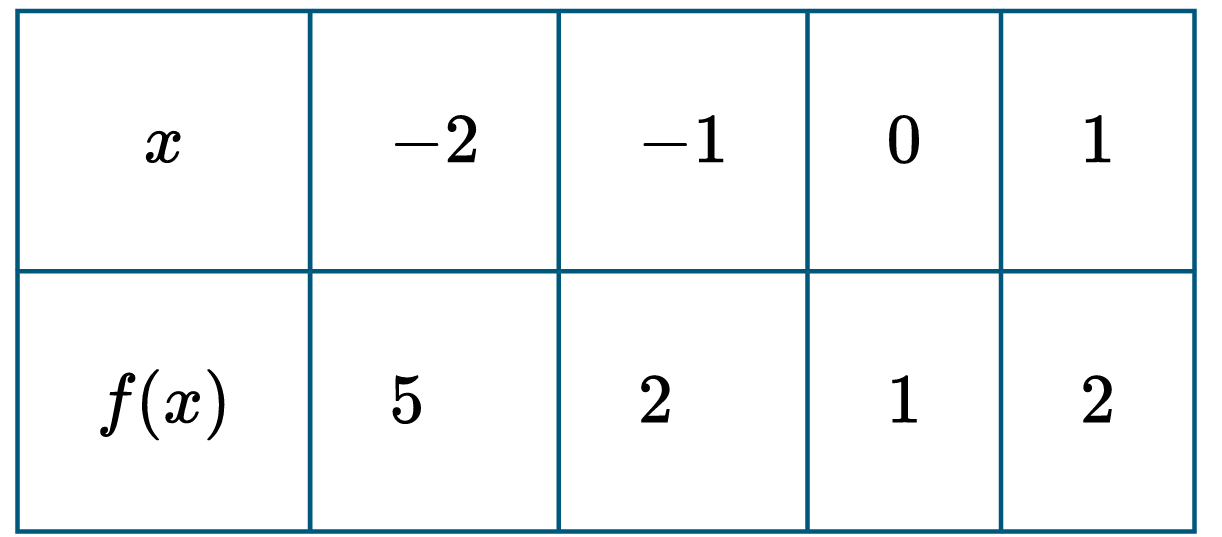
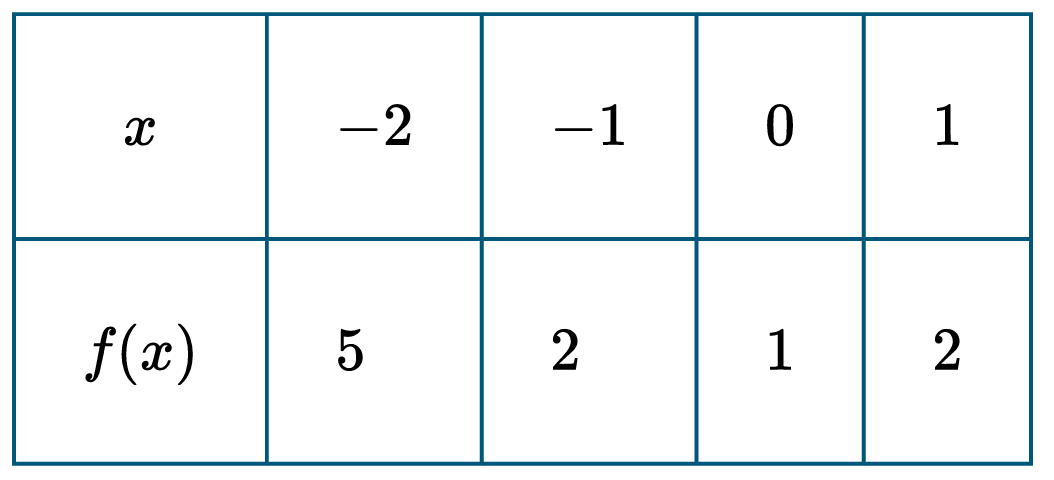
First, calculate the average rates of change for each interval of width $\Delta x = 1$:
For $[-2, -1]$, the rate is $\frac{2 – 5}{-1 – (-2)} = -3$.
For $[-1, 0]$, the rate is $\frac{1 – 2}{0 – (-1)} = -1$.
For $[0, 1]$, the rate is $\frac{2 – 1}{1 – 0} = 1$.
Since the rates of change are not constant, the function cannot be linear.
The rates of change $\{-3, -1, 1\}$ follow a linear pattern described by $y = 2x + 1$ (where $x$ is the left endpoint).
Because the first differences are linear, the function $f$ could be quadratic.
▶️ Answer/Explanation
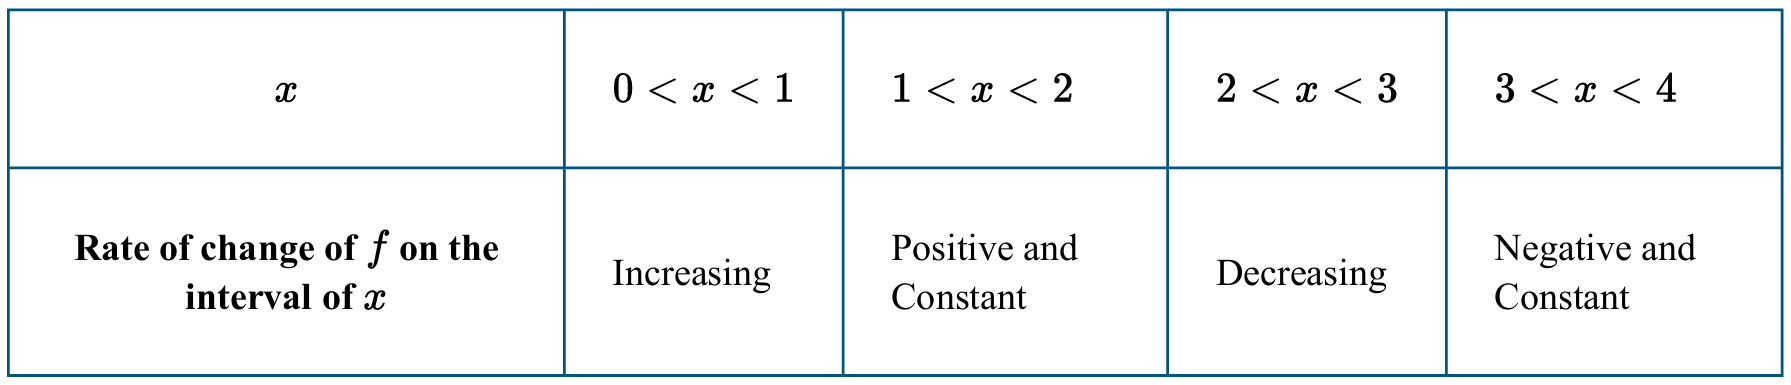
Concavity is determined by the behavior of the rate of change (the first derivative, $f’$).
A function is concave down on an interval if its rate of change is decreasing.
In the interval $0 < x < 1$, the rate of change is increasing, so the graph is concave up.
In the interval $1 < x < 2$, the rate of change is constant, so the graph is linear.
In the interval $2 < x < 3$, the rate of change is decreasing, which fits the definition of concave down.
In the interval $3 < x < 4$, the rate of change is constant, so the graph is linear.
Therefore, the graph of $f$ is concave down only on the interval $2 < x < 3$.
The correct option is (C).
▶️ Answer/Explanation
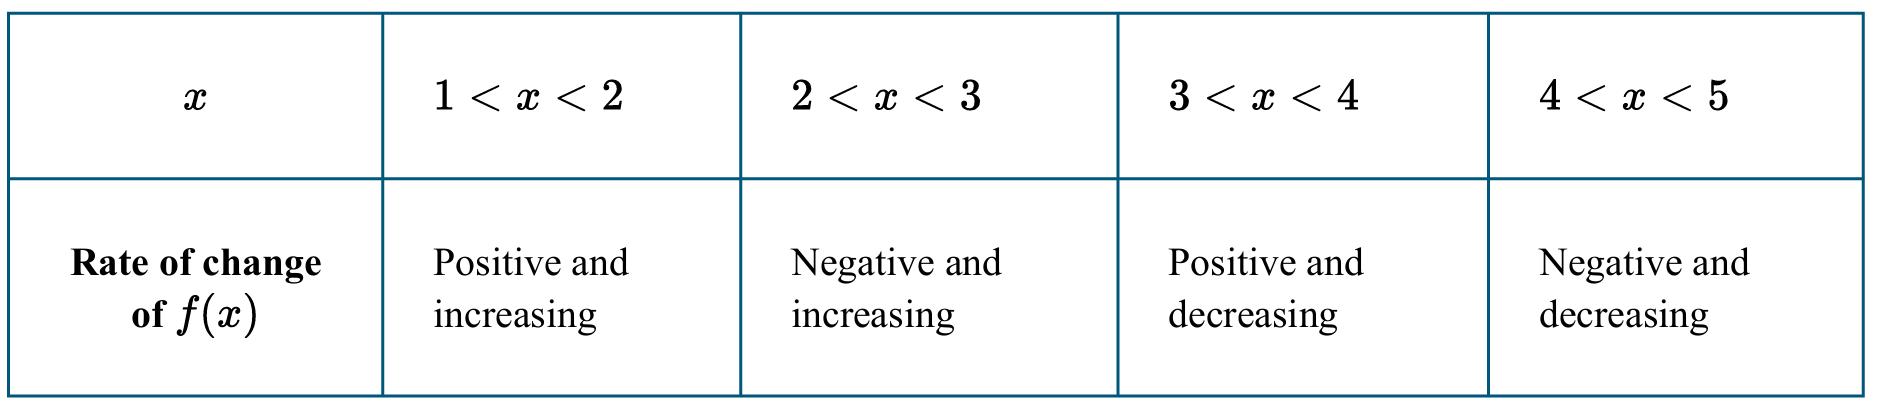
The “rate of change of $f(x)$” corresponds to the first derivative, $f'(x)$.
On the interval $3 < x < 4$, the rate of change is positive, meaning $f'(x) > 0$.
A positive first derivative indicates that the function $f$ is increasing.
The table also specifies that the rate of change is decreasing.
This implies the second derivative, $f”(x)$, is negative because $f'(x)$ is falling.
A negative second derivative ($f”(x) < 0$) means the graph of $f$ is concave down.
Combining these facts, $f$ is increasing and concave down, which is option (A).
▶️ Answer/Explanation
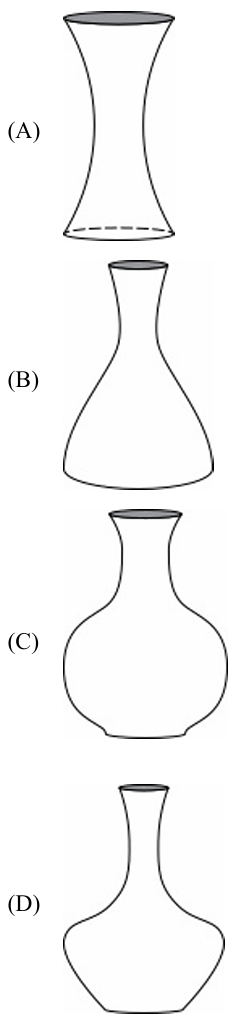
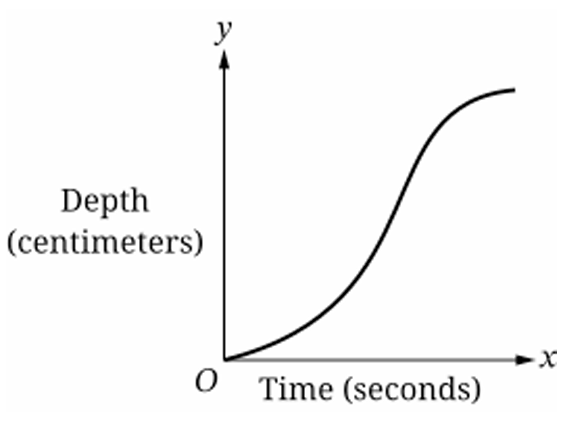
The rate of change of depth $\frac{dh}{dt}$ is inversely proportional to the cross-sectional area of the vase.
A concave up graph indicates that $\frac{d^2h}{dt^2} > 0$, meaning the vase must be narrowing as height increases.
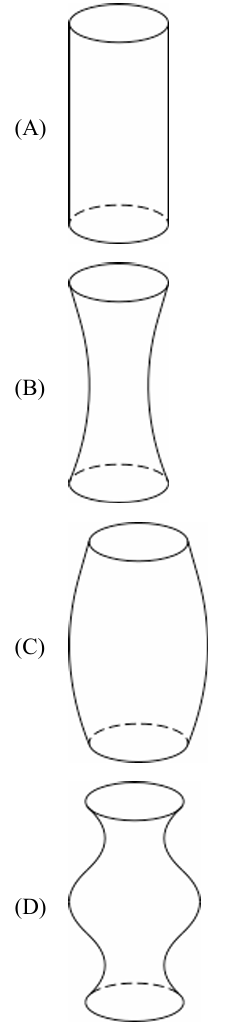
Vase (D) starts with a wide base that curves inward, causing the water level to rise faster and faster (concave up).
A steady and steep increase implies a constant, high rate of change, which occurs in a narrow, cylindrical neck.
Vase (D) features a long, uniform, and very narrow neck, which produces a linear and steep depth-time relationship.
Vase (B) lacks the uniform vertical neck required for a “steady” increase, as its width continues to change at the top.
Vase (A) and (C) do not match the concave up start because they begin by widening at the bottom.
Therefore, Vase (D) is the correct choice as it perfectly aligns with both geometric descriptions in the graph.
▶️ Answer/Explanation
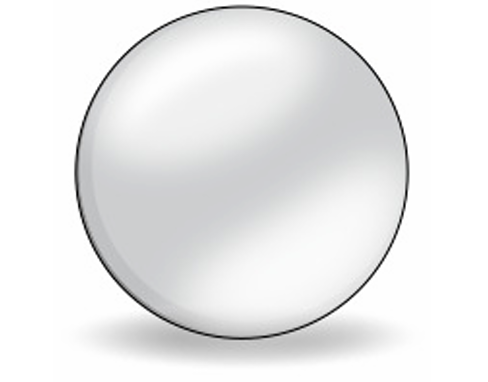
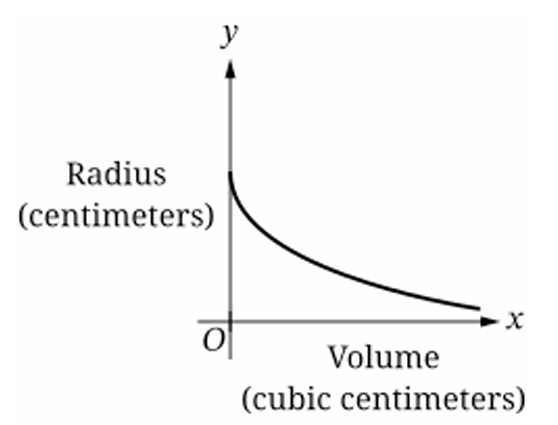
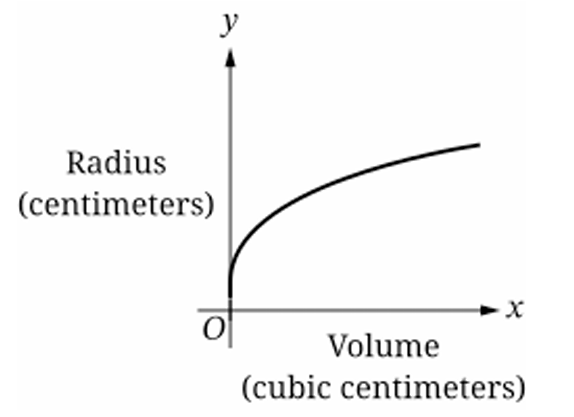
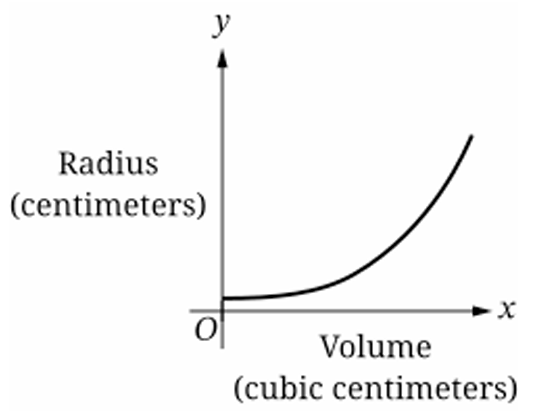
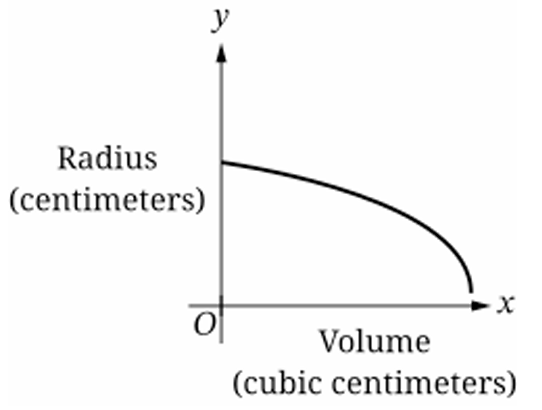
The volume of a sphere is given by $V = \frac{4}{3}\pi r^{3}$, so the radius is $r = \sqrt[3]{\frac{3V}{4\pi}}$.
Since the radius $r$ increases as volume $V$ increases, the graph must have a positive slope.
The problem states the radius increases at a decreasing rate with respect to volume.
This means the slope $\frac{dr}{dV}$ is positive but getting smaller, indicating a concave down shape.
Graph (A) shows a decreasing radius, which contradicts the expansion of the sphere.
Graph (B) shows an increasing radius with a decreasing rate (concave down), matching the description.
Graph (C) shows an increasing rate (concave up), and Graph (D) shows a decreasing radius.
Therefore, the correct graph depicting this relationship is (B).
▶️ Answer/Explanation
The graph shows an S-shaped (sigmoidal) curve.
Initially, the slope is increasing, meaning the depth rises faster as the container narrows.
This indicates the bottom of the container is wide and gets narrower.
In the middle, the slope is steepest where the container is narrowest.
Then, the slope decreases, meaning the depth rises slower as the container widens again.
This matches a container that is wide at the bottom, narrow in the middle, and wide at the top.
Therefore, the correct container is (B).
▶️ Answer/Explanation
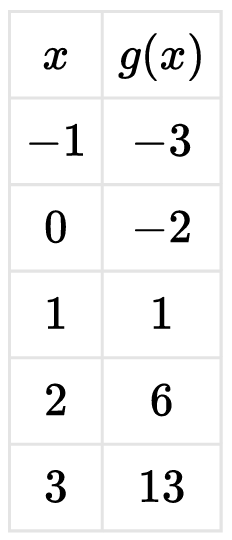
1. Compute first differences: \( -2 – (-3) = 1 \), \( 1 – (-2) = 3 \), \( 6 – 1 = 5 \), \( 13 – 6 = 7 \).
2. First differences are \( 1, 3, 5, 7 \) (not constant).
3. Compute second differences: \( 3 – 1 = 2 \), \( 5 – 3 = 2 \), \( 7 – 5 = 2 \).
4. Second differences are constant and equal to \( 2 \).
5. A constant second difference indicates a quadratic function.
6. Therefore, the correct statement is that \( g \) is best modeled by a quadratic function.
7. Hence, option (D) is correct.
▶️ Answer/Explanation
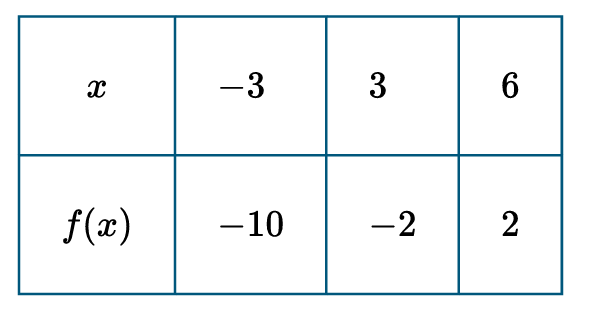
First, calculate the slope (\( m \)) of the linear function using the points \( (-3, -10) \) and \( (3, -2) \):
\( m = \frac{y_2 – y_1}{x_2 – x_1} = \frac{-2 – (-10)}{3 – (-3)} = \frac{8}{6} = \frac{4}{3} \).
Next, use the point-slope form or slope-intercept form \( y = mx + b \) to find the equation. Using point \( (3, -2) \):
\( -2 = \frac{4}{3}(3) + b \implies -2 = 4 + b \implies b = -6 \).
The function is defined as \( f(x) = \frac{4}{3}x – 6 \).
Substitute \( x = 13 \) into the equation to find the required value:
\( f(13) = \frac{4}{3}(13) – 6 = \frac{52}{3} – \frac{18}{3} = \frac{34}{3} \).
Therefore, the correct value is \( \frac{34}{3} \), which matches option (D).

▶️ Answer/Explanation
The average rate of change is defined as the total change in height divided by the total time elapsed.
First, calculate the total change in height for Drone A by summing the changes in each interval: \(17 + (-4) + 11 + (-5) + (-3) = 16 \text{ feet}\).
Next, calculate the total change in height for Drone B by summing its respective changes: \(5 + 3 + 3 + 2 + 3 = 16 \text{ feet}\).
Both drones experienced the same total change in height (\(16 \text{ ft}\)) over the same total time interval (\(30 \text{ seconds}\)).
Since both the numerator (change in height) and denominator (time) are identical for both drones, their average rates of change are equal (\(\frac{16}{30} \text{ ft/s}\)).
Therefore, the correct statement is that the average rates of change are equal.
Correct Option: (A)
▶️ Answer/Explanation
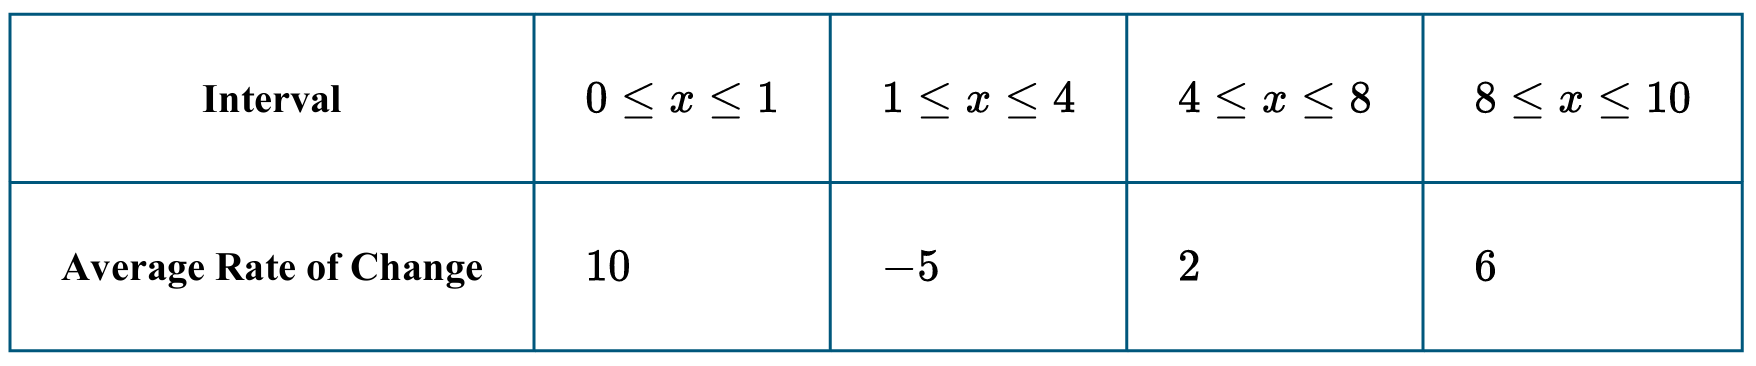
(C) \( 4 \le x \le 8 \)
The total increase over an interval equals: \[ \text{Average Rate of Change} \times \text{Length of Interval}. \]
Compute each increase:
\(0 \le x \le 1:\; 10 \times (1-0) = 10\)
\(1 \le x \le 4:\; (-5) \times (4-1) = -15\)
\(4 \le x \le 8:\; 2 \times (8-4) = 8\)
\(8 \le x \le 10:\; 6 \times (10-8) = 12\)
The greatest positive increase is \(12\), which occurs on \(8 \le x \le 10\).
1. Increase = (average rate of change) × (interval length).
2. For \(0 \le x \le 1\): \(10 \times 1 = 10\).
3. For \(1 \le x \le 4\): \((-5) \times 3 = -15\).
4. For \(4 \le x \le 8\): \(2 \times 4 = 8\).
5. For \(8 \le x \le 10\): \(6 \times 2 = 12\).
6. Largest increase is \(12\), so the correct interval is \(8 \le x \le 10\).
▶️ Answer/Explanation
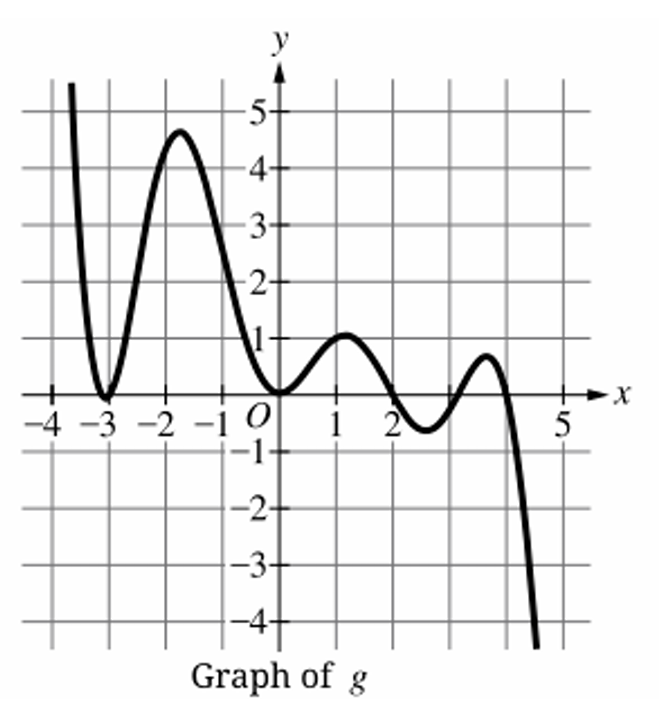
(D) \( 3 \le x \le 4 \)
The average rate of change on an interval \( [a,b] \) is \[ \frac{g(b)-g(a)}{b-a}. \] We estimate values from the graph and compute slopes. The least average rate of change corresponds to the most negative slope.
1. For \( -3 \le x \le -2 \): \( \frac{g(-2)-g(-3)}{1} \approx \frac{4.5-0}{1} = 4.5 \).
2. For \( -1 \le x \le 0 \): \( \frac{g(0)-g(-1)}{1} \approx \frac{0-4}{1} = -4 \).
3. For \( 1 \le x \le 2 \): \( \frac{g(2)-g(1)}{1} \approx \frac{-1-1}{1} = -2 \).
4. For \( 3 \le x \le 4 \): \( \frac{g(4)-g(3)}{1} \approx \frac{-4-0.5}{1} = -4.5 \).
5. The smallest (most negative) value is \( -4.5 \).
6. Therefore, the least average rate of change occurs on \( 3 \le x \le 4 \).
▶️ Answer/Explanation
1. Calculate the rate of change of distance (velocity) for the intervals: \( \frac{9-1}{3-1} = 4 \), \( \frac{21-9}{6-3} = 4 \), and \( \frac{41-21}{11-6} = 4 \).
2. The velocity is constant at \( 4 \, \text{m/s} \) for all time intervals shown.
3. The “rate of change of the rates of change” is the acceleration (derivative of velocity).
4. Since the velocity is constant, the change in velocity is zero, so acceleration is \( 0 \, \text{m/s}^2 \).
5. The correct unit for acceleration is meters per second per second (\( \text{m/s}^2 \)).
6. Since acceleration is \( 0 \), the object is moving at a steady speed, neither speeding up nor slowing down.
7. Therefore, option (B) matches both the value and the description of the motion.
▶️ Answer/Explanation
The correct answer is (D).
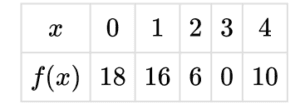
First, calculate the first differences (rates of change) between consecutive \( f(x) \) values:
\( f(-1) – f(-2) = 2 – 5 = -3 \)
\( f(0) – f(-1) = 1 – 2 = -1 \)
\( f(1) – f(0) = 2 – 1 = 1 \)
Since the first differences (\(-3, -1, 1\)) are not constant, \( f \) is not linear.
Next, calculate the second differences: \( -1 – (-3) = 2 \) and \( 1 – (-1) = 2 \). Since the second differences are constant, \( f \) could be a quadratic function.
Finally, check which linear equation describes the rates of change (\(-3, -1, 1\)) based on the starting \( x \) values (\(-2, -1, 0\)):
Using \( y = 2x + 1 \): for \( x = -2 \), \( y = -3 \); for \( x = -1 \), \( y = -1 \); for \( x = 0 \), \( y = 1 \).
This matches the calculated rates perfectly.
▶️ Answer/Explanation
▶️ Answer/Explanation
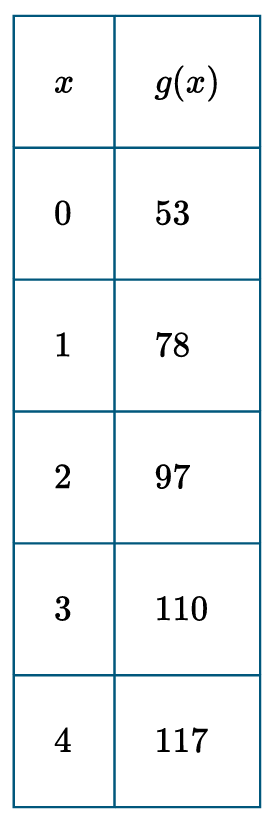
Explanation:
The first differences (average rates of change) are:
\( 78-53 = 25 \),
\( 97-78 = 19 \),
\( 110-97 = 13 \),
\( 117-110 = 7 \).
These are not constant, so the function is not linear.
The second differences are:
\( 19-25 = -6 \),
\( 13-19 = -6 \),
\( 7-13 = -6 \).
Since the second differences are constant (\(-6\)), the function is quadratic.
2. These values are not constant ⇒ not linear.
3. Compute second differences: \(19-25=-6\).
4. \(13-19=-6\).
5. \(7-13=-6\).
6. Second differences are constant ⇒ quadratic model.
7. Therefore, option (D) is correct.
▶️ Answer/Explanation
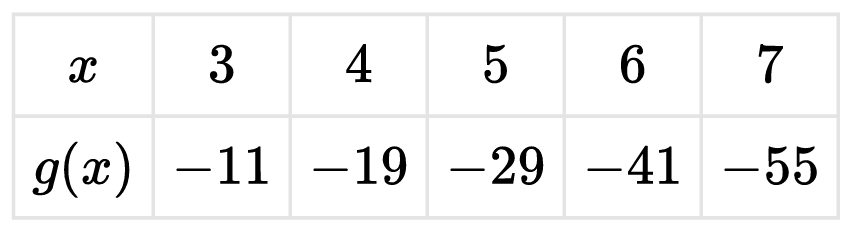
1. Since \( a < b \Rightarrow g(a) > g(b) \), the function is decreasing on \( 3 < x < 7 \).
2. Compute average rates of change over intervals of length \( 1 \):
3. \( \frac{-19 – (-11)}{4-3} = -8 \), \( \frac{-29 – (-19)}{5-4} = -10 \).
4. \( \frac{-41 – (-29)}{6-5} = -12 \), \( \frac{-55 – (-41)}{7-6} = -14 \).
5. The average rates of change are \( -8, -10, -12, -14 \), which are decreasing (becoming more negative).
6. A decreasing function with decreasing slopes indicates the graph is concave down.
7. Therefore, the correct statement is (C).