AP Precalculus -1.4 Polynomial Functions and Rates of Change- FRQ Exam Style Questions - Effective Fall 2023
AP Precalculus -1.4 Polynomial Functions and Rates of Change- FRQ Exam Style Questions – Effective Fall 2023
AP Precalculus -1.4 Polynomial Functions and Rates of Change- FRQ Exam Style Questions – AP Precalculus- per latest AP Precalculus Syllabus.
Question

The graph of $h$ and its dashed midline for two full cycles is shown. Five points, $F, G, J, K,$ and $P$, are labeled on the graph. Determine possible coordinates $(t, h(t))$ for the five points.
The function $h$ can be written in the form $h(t) = a \cos(b(t + c)) + d$. Find values of constants $a, b, c,$ and $d$.
Refer to the graph of $h$ in part (A). The $t$-coordinate of $K$ is $t_1$, and the $t$-coordinate of $P$ is $t_2$.
(i) On the interval $(t_1, t_2)$, which of the following is true about $h$?
a. $h$ is positive and increasing.
b. $h$ is positive and decreasing.
c. $h$ is negative and increasing.
d. $h$ is negative and decreasing.
(ii) Describe how the rate of change of $h$ is changing on the interval $(t_1, t_2)$.
▶️ Answer/Explanation
Part A: Coordinates of Points
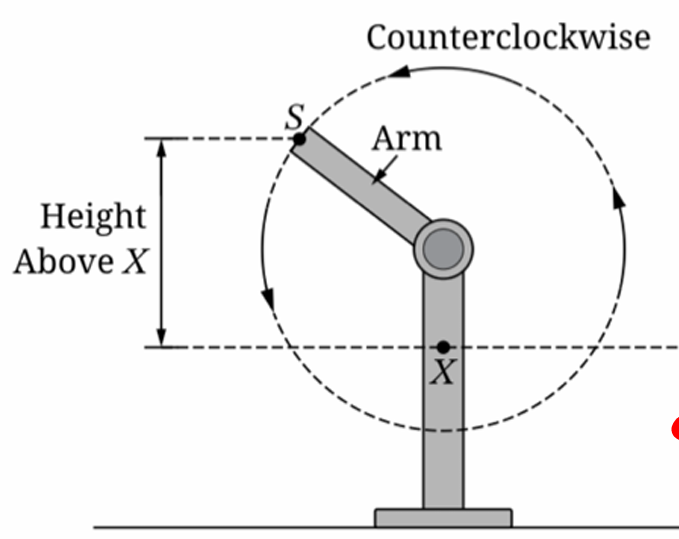
At $t = 0$, $S$ is at its minimum height $-6$ (below $X$).
The maximum height is $20$.
The midline $d = \frac{20 + (-6)}{2} = 7$.
The period is $2$ seconds.
The graph starts at a minimum at $t = 0$, reaches midline at $t = 0.5$, maximum at $t = 1$, midline at $t = 1.5$, and minimum at $t = 2$.
Based on the visual positions in the provided graph:
$F$ (first maximum): $(1, 20)$
$G$ (midline, decreasing): $(1.5, 7)$
$J$ (minimum): $(2, -6)$
$K$ (midline, increasing): $(2.5, 7)$
$P$ (second maximum): $(3, 20)$
Part B: Finding Constants
$a$ (Amplitude) $= \frac{20 – (-6)}{2} = 13$. Since we use $\cos$ and start at a minimum, $a = -13$ (or use a phase shift).
$d$ (Vertical shift/Midline) $= 7$.
$b$ (Frequency factor) $= \frac{2\pi}{\text{period}} = \frac{2\pi}{2} = \pi$.
$c$ (Phase shift): For $h(t) = a \cos(b(t+c)) + d$, if $a = -13$, then at $t=0$, $-13\cos(b(0+c))+7 = -6 \implies \cos(bc)=1 \implies c = 0$.
Final values: $a = -13, b = \pi, c = 0, d = 7$.
Part C: Interval Analysis
(i) At $K$, $h(t)=7$ and is increasing. At $P$, $h(t)=20$ (maximum).
On $(t_1, t_2)$, the height is between $7$ and $20$, so it is positive.
The graph is moving from the midline up to the peak, so it is increasing.
Correct Option: a
(ii) On the interval $(t_1, t_2)$, the graph is concave down as it approaches the maximum.
Therefore, the rate of change of $h$ (the slope) is decreasing.
It starts at its maximum positive value at $K$ and decreases toward zero at $P$.
Question
▶️ Answer/Explanation
a. Graphing the function
Using a graphing utility for \(P(x) = -0.0013x^3 + 0.3507x^2 – 0.4591x – 421.888\) on the interval \([0, 200]\) reveals a cubic curve shape.
The graph starts with a slight dip to a local minimum near \(x=0\), then rises steeply to a local maximum near \(x=180\), before falling again.
b. Average rate of change between extrema
First, find the derivative: \(P'(x) = -0.0039x^2 + 0.7014x – 0.4591\).
Set \(P'(x) = 0\) and use the quadratic formula to find the extrema: \(x \approx 0.66\) (local min) and \(x \approx 179.19\) (local max).
Calculate the profit at these points: \(P(0.66) \approx -422.04\) and \(P(179.19) \approx 3276.57\).
The average rate of change is: \(\frac{3276.57 – (-422.04)}{179.19 – 0.66} = \frac{3698.61}{178.53} \approx 20.72\).
c. Equation of the secant line
The slope \(m\) was found in part (b) to be approximately \(20.72\).
Using the point-slope form \(y – y_1 = m(x – x_1)\) with the minimum point \((0.66, -422.04)\):
\(y – (-422.04) = 20.72(x – 0.66)\)
\(y = 20.72x – 13.68 – 422.04\)
The equation is approximately \(y = 20.72x – 435.72\).
d. Inflection point
Find the second derivative: \(P”(x) = -0.0078x + 0.7014\).
Set \(P”(x) = 0\) to find the change in concavity: \(0 = -0.0078x + 0.7014 \Rightarrow x = \frac{0.7014}{0.0078} \approx 89.92\).
Find the corresponding y-value: \(P(89.92) \approx 1427.27\).
The inflection point is approximately \((89.92, 1427.27)\).
e. Variation of rate of change
The rate of change is represented by the derivative, \(P'(x)\).
Before the inflection point (\(x < 89.92\)), the graph is concave up (\(P”(x) > 0\)), so the rate of change is increasing.
After the inflection point (\(x > 89.92\)), the graph is concave down (\(P”(x) < 0\)), so the rate of change is decreasing.
