AP Precalculus -1.4 Polynomial Functions and Rates of Change- FRQ Exam Style Questions - Effective Fall 2023
AP Precalculus -1.4 Polynomial Functions and Rates of Change- FRQ Exam Style Questions – Effective Fall 2023
AP Precalculus -1.4 Polynomial Functions and Rates of Change- FRQ Exam Style Questions – AP Precalculus- per latest AP Precalculus Syllabus.
Question
(ii) Explain the meaning of these points in context of the problem using the definition of the rate of change and the rate the rate is changing.
Most-appropriate topic codes (AP Precalculus CED):
• 3.4: Sine and Cosine Function Graphs – part A
• 3.5: Sinusoidal Functions – part A
• 3.6: Sinusoidal Function Transformations – part A
• 3.7: Sinusoidal Function Context and Data Modeling – part A, part B, part C(ii)
• 3.8: The Tangent Function – part C(i) (concavity/points of inflection concepts)
• 3.10: Trigonometric Equations and Inequalities – part B
• 1.4: Polynomial Functions and Rates of Change – part C(i), part C(ii) (points of inflection, rate of change concepts)
▶️ Answer/Explanation
Step 1: Identify parameters
– Clock diameter = 24 inches ⇒ radius \( r = 12 \) inches.
– Clock center height above ground: 5 feet = \( 5 \times 12 = 60 \) inches.
– Bottom of clock: \( 60 – 12 = 48 \) inches above ground.
– Top of clock: \( 60 + 12 = 72 \) inches above ground.
– Cycle period = 30 seconds ⇒ \( b = \frac{2\pi}{30} = \frac{\pi}{15} \).
– At \( t = 0 \), second hand points straight up ⇒ height is maximum: \( h(0) = 72 \).
Step 2:
Form of \( h(t) \) General form: \( h(t) = a\cos(b(t + c)) + d \).
Maximum height = \( d + |a| = 72 \)
Minimum height = \( d – |a| = 48 \)
Solve: \( d = \frac{72+48}{2} = 60 \), \( |a| = 72 – 60 = 12 \).
Since at \( t = 0 \) we have max height, choose cosine with no horizontal shift that gives max at \( t=0 \) ⇒ \( a > 0 \), \( c = 0 \) (since \(\cos(0)=1\) gives max).
Thus \( a = 12 \), \( c = 0 \), \( b = \frac{\pi}{15} \), \( d = 60 \).
Step 3: Final function \[ h(t) = 12\cos\left( \frac{\pi}{15} t \right) + 60 \]
Step 1:
Set up equation \[ 12\cos\left( \frac{\pi}{15} t \right) + 60 = 72 – 6\sqrt{2} \] \[ 12\cos\left( \frac{\pi}{15} t \right) = 12 – 6\sqrt{2} \] \[ \cos\left( \frac{\pi}{15} t \right) = 1 – \frac{\sqrt{2}}{2} \]
Note: \( 1 – \frac{\sqrt{2}}{2} \approx 0.2929 \).
Step 2: General solutions Let \( \theta = \frac{\pi}{15} t \). \(\cos \theta = 1 – \frac{\sqrt{2}}{2} \).
Since cosine is positive, solutions are in QI and QIV (for principal values \( 0 \leq \theta < 2\pi \)).
\(\theta_1 = \cos^{-1}\left(1 – \frac{\sqrt{2}}{2}\right)\) \(\theta_2 = 2\pi – \theta_1\).
Step 3: Find \( t \)
\( t = \frac{15}{\pi} \theta \).
Numerically: \( 1 – \frac{\sqrt{2}}{2} \approx 0.292893 \) \(\theta_1 \approx \cos^{-1}(0.292893) \approx 1.2735 \) rad.
\( t_1 \approx \frac{15}{\pi} \times 1.2735 \approx 6.08 \) s. \(\theta_2 \approx 2\pi – 1.2735 \approx 5.0097 \) rad. \( t_2 \approx \frac{15}{\pi} \times 5.0097 \approx 23.92 \) s.
Both are in \( 0 < t \leq 30 \).
Step 4: Exact form Exact \( \theta_1 = \cos^{-1}\left( 1 – \frac{\sqrt{2}}{2} \right) \), but simpler:
Note \( 1 – \frac{\sqrt{2}}{2} = \frac{2 – \sqrt{2}}{2} \).
Thus: \[ t_1 = \frac{15}{\pi} \cos^{-1}\left( \frac{2 – \sqrt{2}}{2} \right), \quad t_2 = 30 – t_1 \]
because cosine is symmetric about \( \theta = \pi \). Final times: \( t \approx 6.08 \) s and \( t \approx 23.92 \) s.
Step 1: Second derivative
\( h(t) = 12\cos\left( \frac{\pi}{15} t \right) + 60 \) \( h'(t) = -12 \cdot \frac{\pi}{15} \sin\left( \frac{\pi}{15} t \right) \)
\( h”(t) = -12 \cdot \frac{\pi^2}{225} \cos\left( \frac{\pi}{15} t \right) = -\frac{4\pi^2}{75} \cos\left( \frac{\pi}{15} t \right) \).
Step 2: Inflection points occur when \( h”(t) = 0 \) \[ \cos\left( \frac{\pi}{15} t \right) = 0 \] \[ \frac{\pi}{15} t = \frac{\pi}{2} + n\pi, \quad n \in \mathbb{Z} \] \[ t = 7.5 + 15n \]
Step 3: In \( 0 \leq t < 30 \) \( n = 0 \): \( t = 7.5 \) s \( n = 1 \): \( t = 22.5 \) s
So yes, there are two points of inflection at \( t = 7.5 \) s and \( t = 22.5 \) s.
At a point of inflection, the rate of change of height \( h'(t) \) is at a local extremum (maximum or minimum magnitude of vertical speed). Equivalently, the acceleration \( h”(t) \) changes sign, meaning the rate at which the height is changing (speed) stops increasing and starts decreasing, or vice versa.
In this problem:
– At \( t = 7.5 \) s, second hand is horizontal (3 o’clock position), vertical speed is maximum in downward direction, and acceleration changes from negative to positive (decelerating downward motion before starting to slow and reverse).
– At \( t = 22.5 \) s, second hand is horizontal (9 o’clock position), vertical speed is maximum in upward direction, and acceleration changes from positive to negative.
Thus, these are the moments when the vertical motion switches from speeding up to slowing down (or vice versa) while moving toward the extreme top or bottom of its path.
Question
(i) Use the given data to write two equations that can be used to find the values for constants \( a \) and \( b \) in the expression for \( G(t) \).
(ii) Find the values for \( a \) and \( b \) as decimal approximations.
(i) Use the given data to find the average rate of change of the number of units of the video game sold, in thousands per day, from \( t=0 \) to \( t=91 \) days. Express your answer as a decimal approximation. Show the computations that lead to your answer.
(ii) Use the average rate of change found in part (i) to estimate the number of units of the video game sold, in thousands, on day \( t=50 \). Show the work that leads to your answer.
(iii) Let \( A_t \) represent the estimate of the number of units of the video game sold, in thousands, using the average rate of change found in part (i). For \( A_{50} \), found in part (ii), it can be shown that \( A_{50} < G(50) \). Explain why, in general, \( A_t < G(t) \) for all \( 0<t<91 \).
The makers of the video game reported that daily sales of the video game decreased each day after \( t=91 \). Explain why the error in the model \( G \) increases after \( t=91 \).
Most-appropriate topic codes (CED):
• TOPIC 1.2: Average Rate of Change — part (B)
• TOPIC 1.4: Function Behavior — part (C)
▶️ Answer/Explanation
(A)(i)
\( G(0)=\ln(a+1)=40 \)
\( G(91)=\ln(a+91b+1)=76 \)
(A)(ii)
From \( \ln(a+1)=40 \Rightarrow a+1=e^{40} \).
From \( \ln(a+91b+1)=76 \Rightarrow a+91b+1=e^{76} \).
Subtracting gives \( 91b=e^{76}-e^{40} \Rightarrow b=\frac{e^{76}-e^{40}}{91} \).
(B)(i)
Average rate of change \(=\frac{76-40}{91}=\frac{36}{91}\approx0.396 \).
(B)(ii)
\( A_{50}=40+0.396(50)=59.8 \).
(B)(iii)
\( G(t) \) is increasing and concave down, so the secant line from \( t=0 \) to \( t=91 \) lies below the graph for \( 0<t<91 \).
(C)
After \( t=91 \), actual sales decrease while the model \( G \) continues to increase, so the difference between actual values and model values grows.
Question
The graph of $h$ and its dashed midline for two full cycles is shown. Five points, $F, G, J, K,$ and $P$, are labeled on the graph. Determine possible coordinates $(t, h(t))$ for the five points.
The function $h$ can be written in the form $h(t) = a \cos(b(t + c)) + d$. Find values of constants $a, b, c,$ and $d$.
Refer to the graph of $h$ in part (A). The $t$-coordinate of $K$ is $t_1$, and the $t$-coordinate of $P$ is $t_2$.
(i) On the interval $(t_1, t_2)$, which of the following is true about $h$?
a. $h$ is positive and increasing.
b. $h$ is positive and decreasing.
c. $h$ is negative and increasing.
d. $h$ is negative and decreasing.
(ii) Describe how the rate of change of $h$ is changing on the interval $(t_1, t_2)$.
▶️ Answer/Explanation
Part A: Coordinates of Points
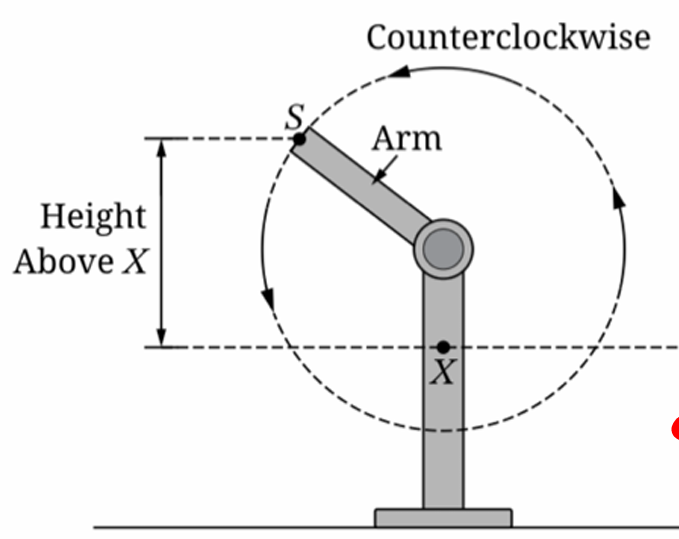
At $t = 0$, $S$ is at its minimum height $-6$ (below $X$).
The maximum height is $20$.
The midline $d = \frac{20 + (-6)}{2} = 7$.
The period is $2$ seconds.
The graph starts at a minimum at $t = 0$, reaches midline at $t = 0.5$, maximum at $t = 1$, midline at $t = 1.5$, and minimum at $t = 2$.
Based on the visual positions in the provided graph:
$F$ (first maximum): $(1, 20)$
$G$ (midline, decreasing): $(1.5, 7)$
$J$ (minimum): $(2, -6)$
$K$ (midline, increasing): $(2.5, 7)$
$P$ (second maximum): $(3, 20)$
Part B: Finding Constants
$a$ (Amplitude) $= \frac{20 – (-6)}{2} = 13$. Since we use $\cos$ and start at a minimum, $a = -13$ (or use a phase shift).
$d$ (Vertical shift/Midline) $= 7$.
$b$ (Frequency factor) $= \frac{2\pi}{\text{period}} = \frac{2\pi}{2} = \pi$.
$c$ (Phase shift): For $h(t) = a \cos(b(t+c)) + d$, if $a = -13$, then at $t=0$, $-13\cos(b(0+c))+7 = -6 \implies \cos(bc)=1 \implies c = 0$.
Final values: $a = -13, b = \pi, c = 0, d = 7$.
Part C: Interval Analysis
(i) At $K$, $h(t)=7$ and is increasing. At $P$, $h(t)=20$ (maximum).
On $(t_1, t_2)$, the height is between $7$ and $20$, so it is positive.
The graph is moving from the midline up to the peak, so it is increasing.
Correct Option: a
(ii) On the interval $(t_1, t_2)$, the graph is concave down as it approaches the maximum.
Therefore, the rate of change of $h$ (the slope) is decreasing.
It starts at its maximum positive value at $K$ and decreases toward zero at $P$.
Question
▶️ Answer/Explanation
a. Graphing the function
Using a graphing utility for \(P(x) = -0.0013x^3 + 0.3507x^2 – 0.4591x – 421.888\) on the interval \([0, 200]\) reveals a cubic curve shape.
The graph starts with a slight dip to a local minimum near \(x=0\), then rises steeply to a local maximum near \(x=180\), before falling again.
b. Average rate of change between extrema
First, find the derivative: \(P'(x) = -0.0039x^2 + 0.7014x – 0.4591\).
Set \(P'(x) = 0\) and use the quadratic formula to find the extrema: \(x \approx 0.66\) (local min) and \(x \approx 179.19\) (local max).
Calculate the profit at these points: \(P(0.66) \approx -422.04\) and \(P(179.19) \approx 3276.57\).
The average rate of change is: \(\frac{3276.57 – (-422.04)}{179.19 – 0.66} = \frac{3698.61}{178.53} \approx 20.72\).
c. Equation of the secant line
The slope \(m\) was found in part (b) to be approximately \(20.72\).
Using the point-slope form \(y – y_1 = m(x – x_1)\) with the minimum point \((0.66, -422.04)\):
\(y – (-422.04) = 20.72(x – 0.66)\)
\(y = 20.72x – 13.68 – 422.04\)
The equation is approximately \(y = 20.72x – 435.72\).
d. Inflection point
Find the second derivative: \(P”(x) = -0.0078x + 0.7014\).
Set \(P”(x) = 0\) to find the change in concavity: \(0 = -0.0078x + 0.7014 \Rightarrow x = \frac{0.7014}{0.0078} \approx 89.92\).
Find the corresponding y-value: \(P(89.92) \approx 1427.27\).
The inflection point is approximately \((89.92, 1427.27)\).
e. Variation of rate of change
The rate of change is represented by the derivative, \(P'(x)\).
Before the inflection point (\(x < 89.92\)), the graph is concave up (\(P”(x) > 0\)), so the rate of change is increasing.
After the inflection point (\(x > 89.92\)), the graph is concave down (\(P”(x) < 0\)), so the rate of change is decreasing.