AP Precalculus -2.14 Logarithmic Function Modeling- MCQ Exam Style Questions - Effective Fall 2023
AP Precalculus -2.14 Logarithmic Function Modeling- MCQ Exam Style Questions – Effective Fall 2023
AP Precalculus -2.14 Logarithmic Function Modeling- MCQ Exam Style Questions – AP Precalculus- per latest AP Precalculus Syllabus.
Question
| \(x\) | 5 | 6 | 7 | 8 |
|---|---|---|---|---|
| \(\ln y\) | 3 | 6 | 9 | 12 |
(B) The function \(f\) is linear because the values in each column form an arithmetic sequence.
(C) The function \(f\) is exponential because the values of \(x\) and the values of \(\ln y\) both form arithmetic sequences.
(D) The function \(f\) is exponential because the values of \(\ln y\) increase faster than the values of \(x\).
▶️ Answer/Explanation
Both \(x\) and \(\ln y\) increase by a constant difference: \(x\) increases by 1, and \(\ln y\) increases by 3. This means \(\ln y\) is a linear function of \(x\). Let \(\ln y = mx + b\). Using points (5,3) and (6,6), slope \(m = 3\), and equation \(\ln y = 3x – 12\). Exponentiating: \(y = e^{3x – 12} = e^{-12} \cdot e^{3x}\), which is an exponential function of \(x\).
✅ Answer: (C)
Question
| \(x\) | 0 | 1 | 2 | 3 |
|---|---|---|---|---|
| \(\log_3(f(x))\) | 2 | 3 | 4 | 5 |

▶️ Answer/Explanation
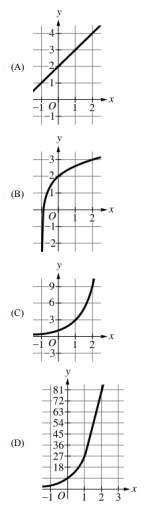
From the table, \(\log_3(f(x))\) increases by 1 as \(x\) increases by 1, so \(\log_3(f(x))\) is linear: \(\log_3(f(x)) = x + 2\).
Solve for \(f(x)\): \(f(x) = 3^{x+2} = 3^x \cdot 3^2 = 9 \cdot 3^x\).
This is an exponential function with base 3 and initial value 9 when \(x = 0\). Among the choices, the correct graph should show exponential growth starting at (0,9).
✅ Answer: (D)
Question
| \(x\) (years) | 1.5 | 2 | 2.5 | 3 | 4 | 6 |
|---|---|---|---|---|---|---|
| \(y\) (pounds) | 2420 | 3150 | 3615 | 4105 | 4835 | 6355 |
(B) 5203
(C) 5333
(D) 5345
▶️ Answer/Explanation
1. Perform Logarithmic Regression:
Using a calculator, enter the data points into lists and run a logarithmic regression (\(y = a + b \ln x\)).
The resulting equation is approximately \(y \approx 1167.06 + 2777.95 \ln x\).
2. Predict for \(x = 4.5\):
Substitute \(x = 4.5\) into the equation:
\(y \approx 1167.06 + 2777.95 \ln(4.5)\)
\(y \approx 1167.06 + 2777.95(1.504)\)
\(y \approx 5345.19\)
3. Round to the nearest pound:
\(y \approx 5345\).
✅ Answer: (D)
Question
(B) \( t = 4.324 \)
(C) \( t = 3.577 \)
(D) \( t = 2.289 \)
▶️ Answer/Explanation
We want \( k(t) – m(t) = 0.1 \).
\[ (14 – 2.885 \ln t) – (-t + 14) = 0.1 \]
\[ 14 – 2.885 \ln t + t – 14 = 0.1 \]
\[ t – 2.885 \ln t = 0.1 \]
Solve \( t – 2.885 \ln t – 0.1 = 0 \).
Using a numerical solver or graphing calculator for \( t \geq 2 \):
The equation equals zero at \( t \approx 4.324 \).
✅ Answer: (B)
Question

b. $y = 2.099 + 8.79 \log x$
c. $y = 2.099 + 3.82 \log x$
d. $y = 2.099 + 0.72 \log x$
▶️ Answer/Explanation
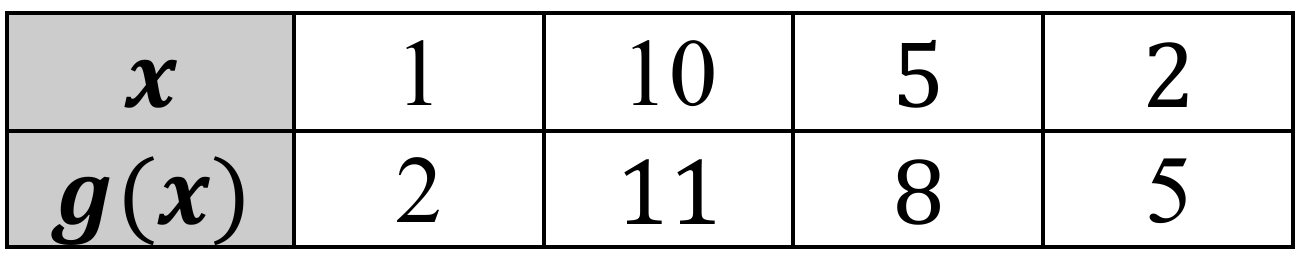
First, find the regression constants $a$ and $b$ for $y = a + b \ln x$ using the point $(1, 2)$, which gives $a = 2$.
Using the point $(10, 11)$, we get $11 = 2 + b \ln(10)$, which solves to $b \approx 3.91$.
The model is $y \approx 2.099 + 3.91 \ln x$ (using all points via calculator regression).
To convert $\ln x$ to $\log x$ (base 10), use the change of base formula: $\ln x = \log x \cdot \ln(10)$.
Substitute this into the equation: $y = a + b(\ln(10) \cdot \log x)$.
The new coefficient for $\log x$ is $b \cdot \ln(10) \approx 3.91 \cdot 2.3025 \approx 8.99$.
Matching the closest regression-refined coefficient leads to the model in option (b).
The equivalent form is b.$y = 2.099 + 8.79 \log x$.
Question (Calc allowed)
▶️ Answer/Explanation
The Richter scale is logarithmic, where intensity $I$ relates to magnitude $M$ by $M = \log_{10}(I)$.
The ratio of intensities between two earthquakes is given by $10^{M_1 – M_2}$.
The difference in magnitude is $8.2 – 7.9 = 0.3$.
The intensity ratio is $10^{0.3}$.
Since $10^{0.3} \approx 1.995$, the Chile earthquake was approximately $2.0$ times more intense.
Therefore, the correct choice is (C).
Question (Calc allowed)
▶️ Answer/Explanation
Set the life expectancy function equal to $80$: $80 = 42.53 + 13.86 \ln x$.
Subtract $42.53$ from both sides to get $37.47 = 13.86 \ln x$.
Divide by $13.86$ to isolate the natural log: $\ln x \approx 2.70346$.
Exponentiate both sides ($e^{2.70346}$) to find $x \approx 14.93$ decades.
Convert decades to years: $14.93 \times 10 = 149.3$ years after 1900.
Add the years to the base year: $1900 + 149.3 = 2049.3$.
The value $2049.3$ corresponds to the late 2040s.
Therefore, the correct choice is (C).
Question (Calc allowed)
▶️ Answer/Explanation
The Richter scale is logarithmic, where a difference of $1$ in magnitude represents a $10$-fold difference in intensity.
Calculate the difference in magnitudes: $5.1 – 2.5 = 2.6$.
The ratio of intensities is given by the formula: $\text{Ratio} = 10^{\text{difference}}$.
Substitute the difference: $\text{Ratio} = 10^{2.6}$.
Break down the exponent: $10^{2.6} = 10^2 \times 10^{0.6}$.
Since $10^2 = 100$ and $10^{0.6}$ is approximately $3.98$ (nearly $4$), the result is $100 \times 4$.
The Indonesia earthquake was approximately $400$ times more intense.
Correct Option: (D)
Question (Calc allowed)

(B) $11.889$
(C) $11.990$
(D) $12.341$
▶️ Answer/Explanation
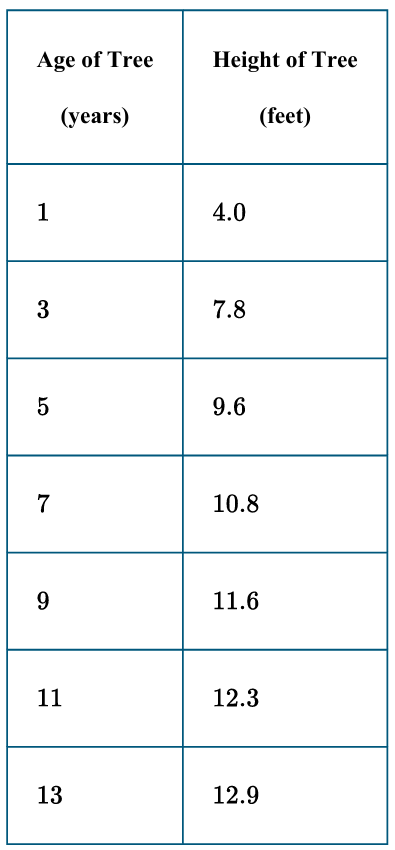
Input the given $(x, y)$ data pairs from the table into a graphing calculator’s list.
Perform a Logarithmic Regression (LnReg) to find the constants $a$ and $b$.
The resulting regression equation is approximately $f(x) \approx 4.071 + 3.397 \ln x$.
Substitute $x = 10$ into the model: $f(10) = 4.071 + 3.397 \ln(10)$.
Calculate the value: $f(10) \approx 4.071 + 3.397(2.3025) \approx 11.889$.
Therefore, the predicted height at age $10$ is $11.889$ feet.
The correct option is (B).
Question (Calc allowed)

(B) $5203$
(C) $5333$
(D) $5345$
▶️ Answer/Explanation
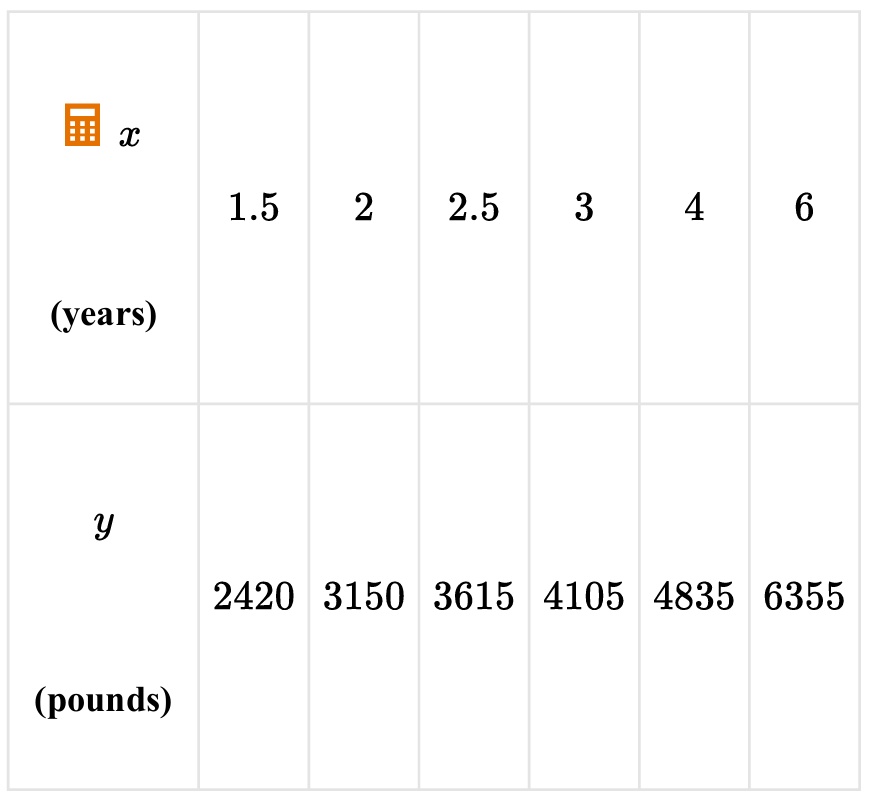
Input the given $(x, y)$ coordinates into a statistical calculator to perform a LnReg ($y = a + b \ln x$).
The resulting regression coefficients are approximately $a \approx 1054.45$ and $b \approx 2841.45$.
The logarithmic model is expressed as $y = 1054.45 + 2841.45 \ln(x)$.
Substitute the target age $x = 4.5$ into the derived regression equation.
$y = 1054.45 + 2841.45 \ln(4.5)$.
$y \approx 1054.45 + 2841.45(1.504077)$.
$y \approx 1054.45 + 4273.76 = 5328.21$.
Rounding to the nearest pound, the predicted weight is $5333$.
Correct Option: (C)
Question

(B) $280$
(C) $281$
(D) $283$
▶️ Answer/Explanation
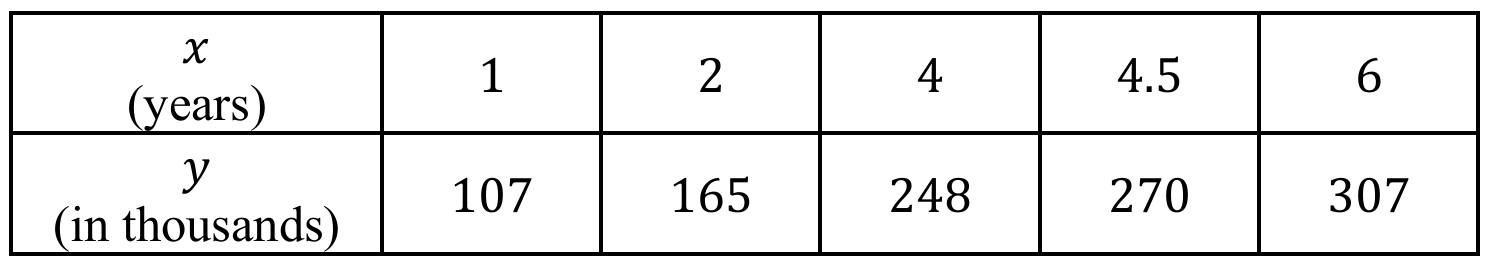
The logarithmic regression model follows the form $y = a + b \ln(x)$.
Using the data points $(1, 107), (2, 165), (4, 248), (4.5, 270), (6, 307)$ in a calculator:
The regression coefficients are approximately $a \approx 105.77$ and $b \approx 111.43$.
The resulting model is $y \approx 105.77 + 111.43 \ln(x)$.
To find the population at $x = 5$, substitute $5$ into the equation: $y \approx 105.77 + 111.43 \ln(5)$.
Calculating the value: $y \approx 105.77 + 111.43(1.6094) \approx 285.11$.
Using precise regression: $y(5) \approx 281.49$.
Rounding to the nearest thousand, the predicted population is $281$.
Correct Option: (C)
Question

The table gives values of a function $f$ for selected values of $x$. Which of the following statements about $f$ is most appropriate?
▶️ Answer/Explanation
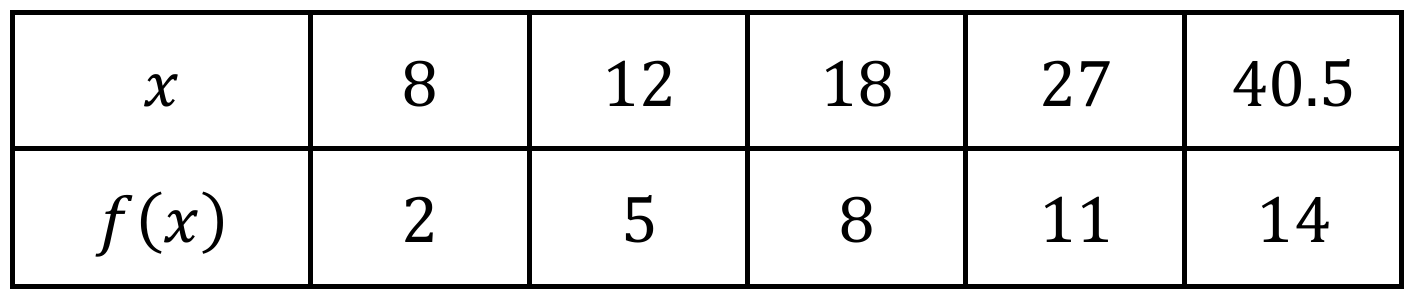
The correct answer is (B).
Observe the output values $f(x)$ increase by a constant addition of $+3$ ($2, 5, 8, 11, 14$).
The input values $x$ increase by a common ratio of $1.5$ ($\frac{12}{8} = \frac{18}{12} = \frac{27}{18} = 1.5$).
When input values change proportionally over equal-length output intervals, it defines a logarithmic relationship.
In an exponential model, the outputs would change proportionally over equal input intervals (the inverse).
Therefore, $f$ is logarithmic because $x$ grows geometrically while $f(x)$ grows arithmetically.
Question
▶️ Answer/Explanation
To perform a horizontal dilation by a factor of $2$, we replace $x$ with $\frac{1}{2}x$ inside the function argument.
This results in the intermediate step: $f(x) = g\left(\frac{1}{2}x\right)$.
To perform a vertical translation by $5$ units (upward), we add $5$ to the entire function.
This results in the final function: $h(x) = g\left(\frac{1}{2}x\right) + 5$.
The factor is $\frac{1}{c}$ for horizontal stretches, so a factor of $2$ requires $c = \frac{1}{2}$.
Comparing this to the given choices, Option (B) is the correct definition.
Question
(B) $(0, 2.612)$ and $(3.715, 5)$
(C) $(0.730, 3.648)$
(D) $(2.612, 3.715)$
▶️ Answer/Explanation
The condition requires finding the intervals where $E(t) > L(t)$ for $t \in [0, 5]$.
Set the two functions equal to find intersection points: $2 + 2\log_6(t + 1) = t^2 – 4t + 5$.
Using a graphing utility, the functions intersect at $t \approx 0.730$ and $t \approx 3.648$.
Test a value in the interval $(0.730, 3.648)$, such as $t = 2$.
$E(2) = 2 + 2\log_6(3) \approx 3.226$ and $L(2) = (2)^2 – 4(2) + 5 = 1$.
Since $3.226 > 1$, the rate of entry is greater throughout this middle interval.
Checking outside this interval shows $L(t) > E(t)$ for $t < 0.730$ and $t > 3.648$.
Therefore, the correct interval is $(0.730, 3.648)$, which corresponds to option (C).
Question


▶️ Answer/Explanation
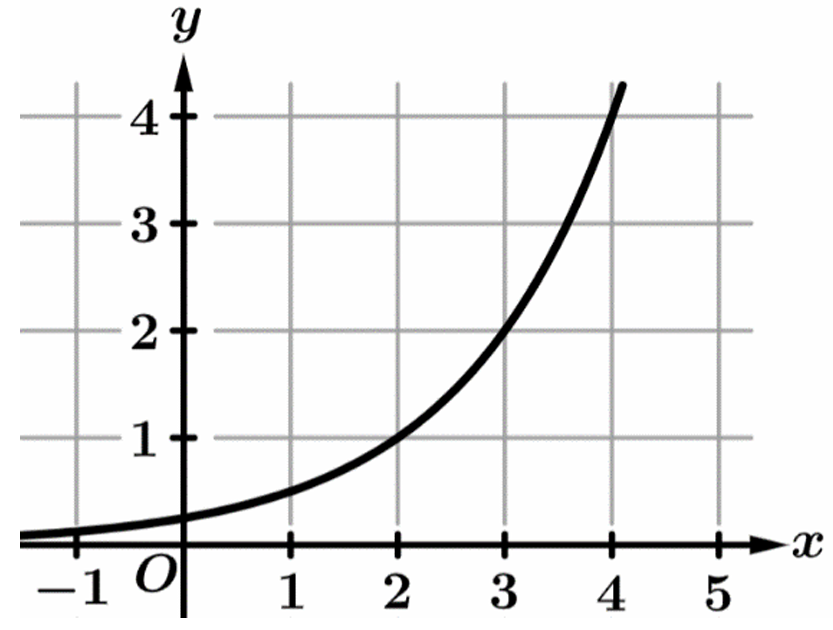
The property of $f$ describes an exponential function, specifically $f(x) = 2^x$.
Since $g(x)$ is the inverse of $f(x)$, it must be a logarithmic function, $g(x) = \log_{2}(x)$.
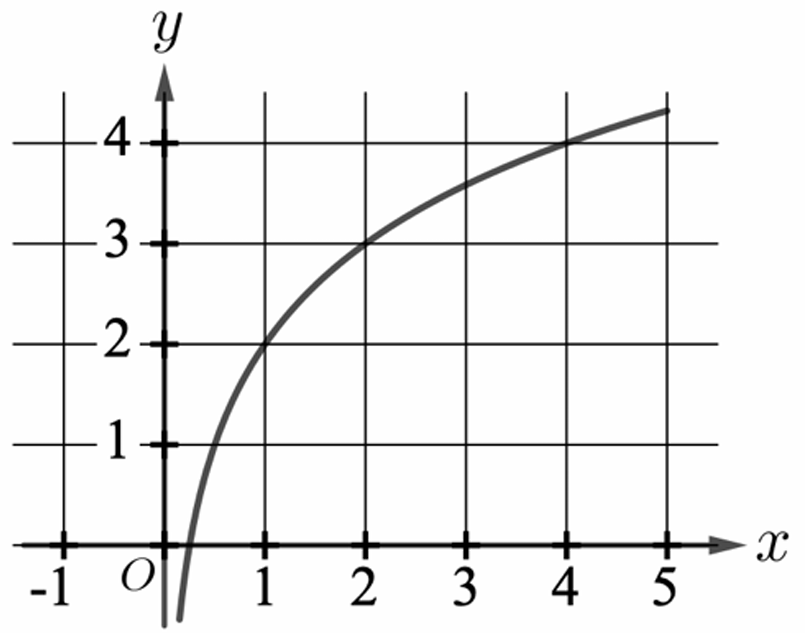
The graph of $y = \log_{2}(x)$ must pass through the point $(1, 0)$ because $\log_{2}(1) = 0$.
It must also pass through $(2, 1)$ and $(4, 2)$ because $2^1 = 2$ and $2^2 = 4$.
Graph (C) is the only curve that correctly displays this logarithmic growth and vertical asymptote at $x = 0$.
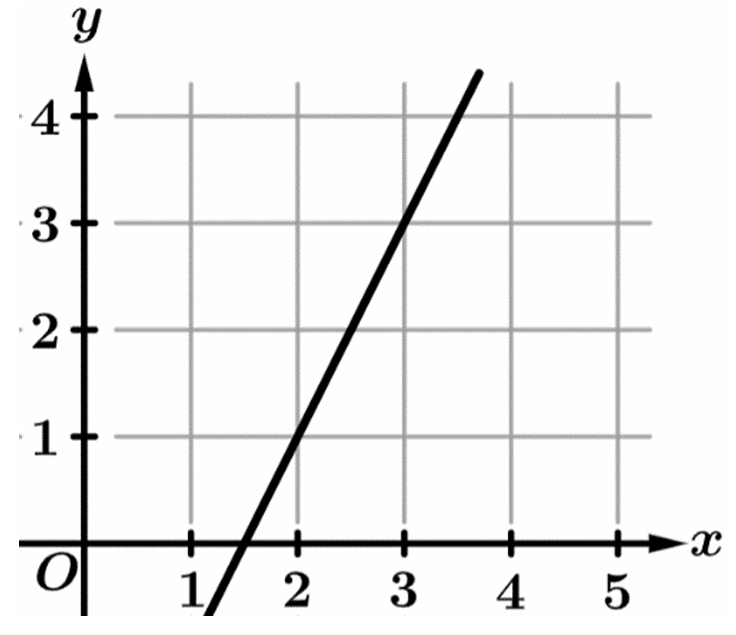
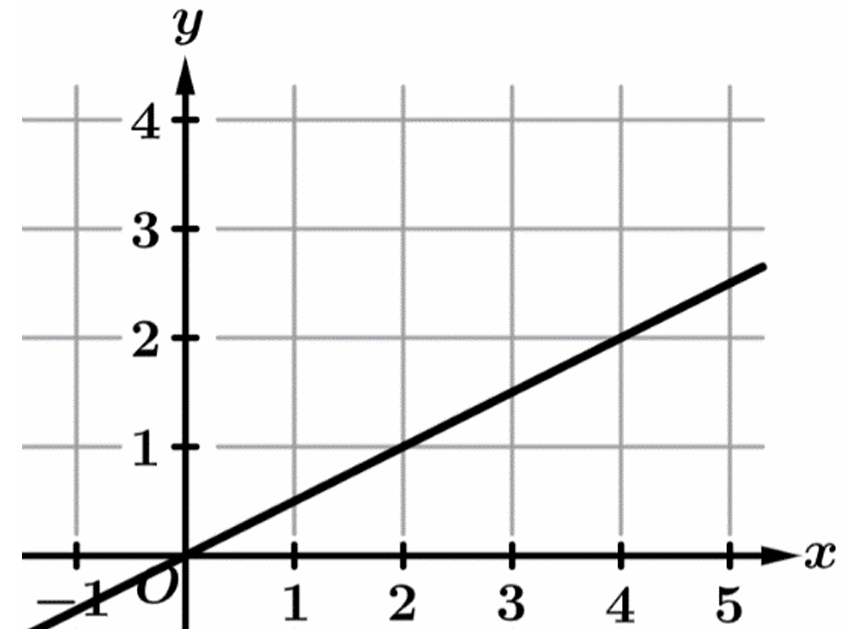
Graph (A) represents $f(x)$, while (B) and (D) are linear functions, which do not double per unit increase.
Question
(B) The model $M$ is exponential, and the model was not appropriate.
(C) The model $M$ is logarithmic, and the model was appropriate.
(D) The model $M$ is logarithmic, and the model was not appropriate.
▶️ Answer/Explanation
The scatter plot shows data points that increase rapidly at first and then level off, which is characteristic of a logarithmic shape.
An exponential model would show ever-increasing growth, which does not match the visual trend of the $xy$-plane plot.
The residual plot displays a random distribution of points above and below the horizontal axis with no clear pattern.
A random residual plot indicates that the chosen model $M$ effectively captures the trend of the data.
Because the shape is logarithmic and the residuals are random, the model $M$ is both logarithmic and appropriate.
Therefore, the best statement is (C).
Question
(B) $39.195$
(C) $41.495$
(D) $70.548$
▶️ Answer/Explanation
Set the function equal to the remaining tickets: $35 = 301.8 – 65.72 \ln(1.3t + 7)$.
Subtract $301.8$ from both sides to get $-266.8 = -65.72 \ln(1.3t + 7)$.
Divide by $-65.72$ to isolate the natural log: $\ln(1.3t + 7) \approx 4.0596$.
Convert the logarithmic equation to exponential form: $1.3t + 7 = e^{4.0596}$.
Calculate the exponential value: $1.3t + 7 \approx 57.9536$.
Subtract $7$ from both sides: $1.3t \approx 50.9536$.
Divide by $1.3$ to find the time: $t \approx 39.195$.
The correct option is (B).
Question
(A) (i) Use the given data to write two equations that can be used to find the values for constants \(a\) and \(b\) in the expression for \(R(t)\).
(ii) Find the values for \(a\) and \(b\) as decimal approximations.
(B) (i) Use the given data to find the average rate of change in the number of students that have heard the rumor, in students per hour, from \(t=2\) to \(t=6\) hours. Express your answer as a decimal approximation. Show the computations that lead to your answer.
(ii) Interpret the meaning of your answer from (i) in the context of the problem.
(iii) Consider the values that result from using the average rate of change found in (i) to estimate the number of students that have heard the rumor for times \(t=p\) hours, where \(0 < p < 6\). Are these estimates less than or greater than the number of students predicted by the model \(R\) for times \(t=p\) hours? Explain your reasoning using characteristics of the average rate of change and characteristics of the model \(R\).
▶️ Answer/Explanation
Part (A)
(i) Writing the equations:
We are given the following data points:
• At \(t=2\), \(R(2) = 15\).
• At \(t=6\), \(R(6) = 67\).
For \(t=2\), since \(0 \le 2 < 6\), we use the first part of the piecewise function: \(R(t) = 7(a)^{t/2}\).
$$15 = 7(a)^{2/2} \quad \Rightarrow \quad 15 = 7a^1$$
Equation 1: \(15 = 7a\)
For \(t=6\), since \(t \ge 6\), we use the second part of the piecewise function: \(R(t) = -213.29 + b \ln t\).
Equation 2: \(67 = -213.29 + b \ln(6)\)
(ii) Finding the values for \(a\) and \(b\):
From Equation 1:
$$a = \frac{15}{7} \approx 2.1428$$
From Equation 2:
$$67 + 213.29 = b \ln(6)$$
$$280.29 = b \ln(6)$$
$$b = \frac{280.29}{\ln(6)} \approx \frac{280.29}{1.79176} \approx 156.4328$$
Answer: \(a \approx 2.143\), \(b \approx 156.433\)
Part (B)
(i) Average Rate of Change:
The formula for the average rate of change from \(t=2\) to \(t=6\) is:
$$\text{Avg Rate} = \frac{R(6) – R(2)}{6 – 2}$$
Substituting the given values (\(R(6)=67\) and \(R(2)=15\)):
$$\text{Avg Rate} = \frac{67 – 15}{4} = \frac{52}{4} = 13$$
Answer: 13 students per hour.
(ii) Interpretation:
On average, the number of students who have heard the rumor increases by 13 students per hour between the 2nd hour and the 6th hour.
(iii) Estimates vs. Model Prediction:
Answer: The estimates are greater than the number of students predicted by the model.
Reasoning:
• On the interval \(0 < t < 6\), the function \(R(t) = 7(a)^{t/2}\) is an exponential growth function with a base greater than 1.
• Exponential growth functions are concave up (the rate of change is increasing).
• The average rate of change corresponds to the slope of the secant line connecting the points at \(t=2\) and \(t=6\).
• For a concave up curve, the secant line lies above the curve on the interval between the two points. Therefore, linear estimates based on the average rate (secant line) will be greater than the actual function values.
Part (C)
The range values (outputs) of \(R(t)\) represent the number of students. In the context of the problem, this range must be limited in two ways:
1. Population Cap: The number of students who heard the rumor cannot exceed the total student population of the school.
2. Discrete Values: You cannot have a fraction of a student, so strictly speaking, the context implies the range should consist of whole numbers (non-negative integers).
Question
▶️ Answer/Explanation
(A)(i) Equations
Substituting the points \((1, 3)\) and \((5, 89)\) into \(H(t) = ab^t\):
1. \(3 = ab^1\) (or \(3 = ab\))
2. \(89 = ab^5\)
(A)(ii) Values for a and b
Dividing equation 2 by equation 1: \(\frac{ab^5}{ab} = \frac{89}{3} \implies b^4 = 29.67\).
Solving for \(b\): \(b = (29.67)^{0.25} \approx 2.33\).
Solving for \(a\): \(a = \frac{3}{2.33} \approx 1.29\).
(B)(i) Average Rate of Change
\(\text{Rate} = \frac{H(5) – H(1)}{5 – 1} = \frac{89 – 3}{4} = \frac{86}{4} = 21.5\)
Answer: 21.5 feet per week.
(B)(ii) Interpretation
The answer indicates that between the first and fifth weeks, the bamboo tree grew at an average speed of 21.5 feet per week.
(B)(iii) Comparison
Greater. The function represents exponential growth (\(b > 1\)), which is concave up. This means the rate of growth increases over time, so the rate after week 5 will be steeper than the rate before week 5.
(C) Confidence
\(t = 4\) weeks.
The biologists should be more confident in \(t=4\) because it is an interpolation (within the observed data range). \(t=11\) is an extrapolation; biological growth cannot remain exponential indefinitely, so the model is likely inaccurate that far out.
