
▶️ Answer/Explanation
A semi-log plot appears linear when the data follow an exponential model. In such a plot, a straight line corresponds to exponential growth of the form \( N(t) = a \cdot b^{t} \). The slope of the line in the semi-log plot relates to the growth factor over time.
Given the answer choice (C): \( N(t) = 2.5 \cdot 2^{(t/10)} \)
This means the population doubles every 10 days (since when \( t \) increases by 10, \( 2^{(t/10)} \) doubles). At \( t = 0 \), \( N(0) = 2.5 \) thousand, and at \( t = 10 \), \( N(10) = 2.5 \cdot 2 = 5 \) thousand, matching a point from the semi-log data if the plot is linear.
✅ Answer: (C)
▶️ Answer/Explanation
A semi‑log plot has a logarithmic vertical axis and linear horizontal axis. For an exponential function, the semi‑log plot appears linear.
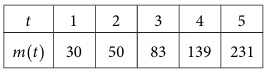
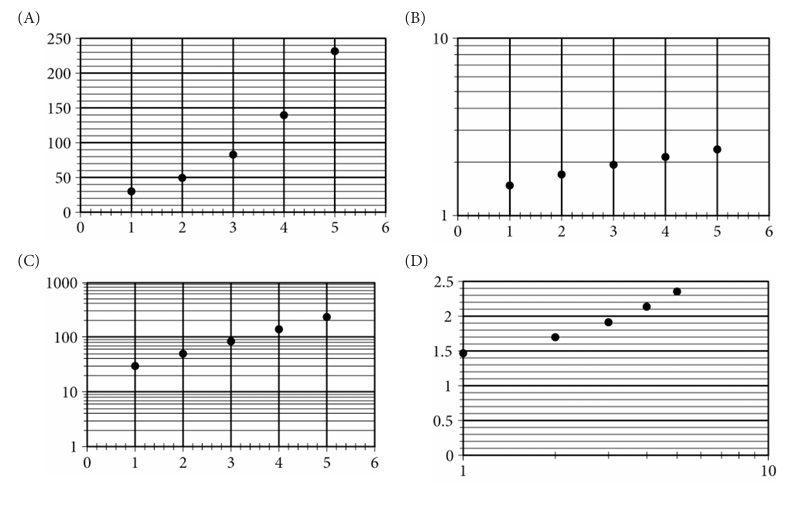
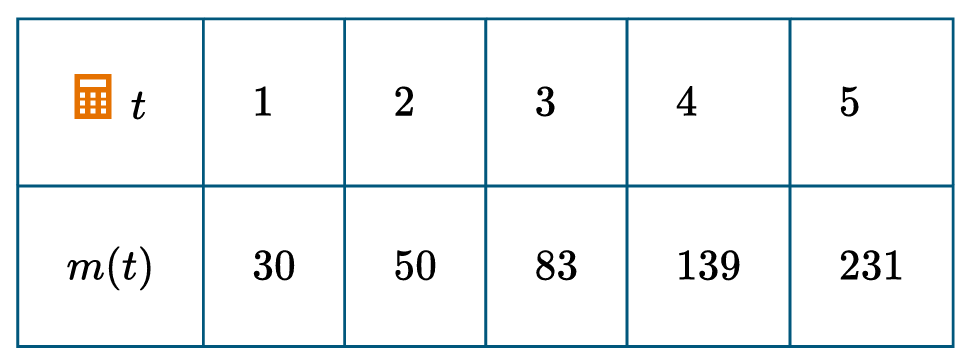
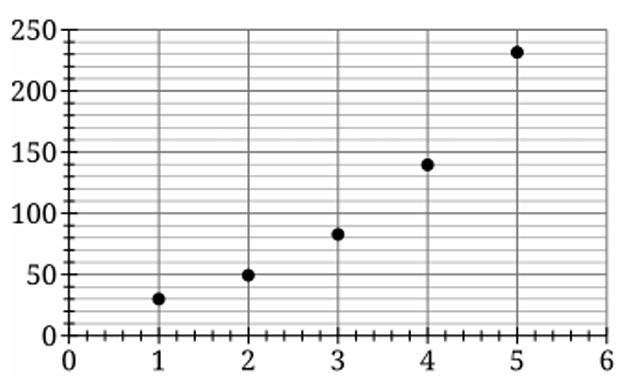
From the table: \( m(t) \) grows roughly by a constant factor (exponential). In a semi‑log plot, points \( (t, m(t)) \) are plotted with \( m(t) \) on a log scale.
Check values:
- log₁₀(30)≈1.48,
- log₁₀(50)≈1.70,
- log₁₀(83)≈1.92,
- log₁₀(139)≈2.14,
- log₁₀(231)≈2.36
increases roughly linearly in \( t \).
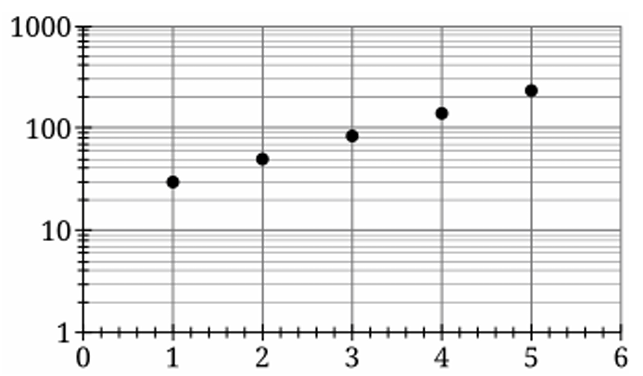
Graph C shows vertical axis labeled 1, 10, 100, 1000 (log scale) and likely shows points forming a straight line.
✅ Answer: (C)
▶️ Answer/Explanation
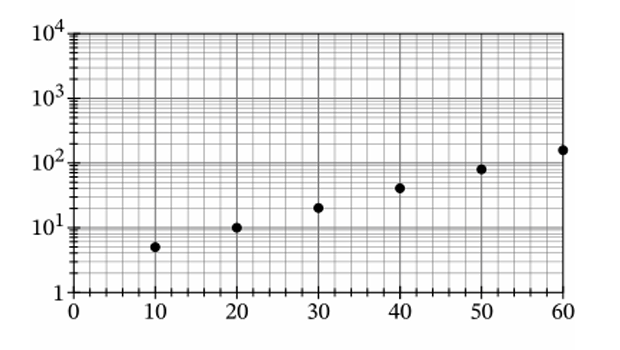
The plot is semi-logarithmic, where a linear trend indicates an exponential function.
At $t = 20$, the point on the graph is at $10^1$, which means $N(20) = 10$.
At $t = 50$, the point is just below $10^2$ (roughly $80$); checking option (C): $2.5 \cdot 2^{(50/10)} = 2.5 \cdot 32 = 80$.
Testing option (C) for $t = 20$ gives $2.5 \cdot 2^{(20/10)} = 2.5 \cdot 4 = 10$, matching the data exactly.
Options (A) and (B) are linear functions, which would appear curved on a semi-log scale.
Option (D) at $t = 20$ yields $3 + 2^2 = 7$, which does not match the observed value of $10$.
Therefore, the function that correctly defines the data is (C).
▶️ Answer/Explanation
The correct graph is (C).
A semi-log plot uses a logarithmic scale for the vertical axis to linearize exponential data.
The data values for $m(t)$ range from $30$ to $231$.
The vertical axis must include the interval $[30, 231]$, which fits within the $10$ to $1000$ scale.
The constant ratio $\frac{m(t+1)}{m(t)} \approx 1.67$ indicates the function is exponential.
On a logarithmic scale, this exponential relationship appears as a straight line.
Graph (C) shows the points forming a linear pattern on a log-scaled $y$-axis.
▶️ Answer/Explanation
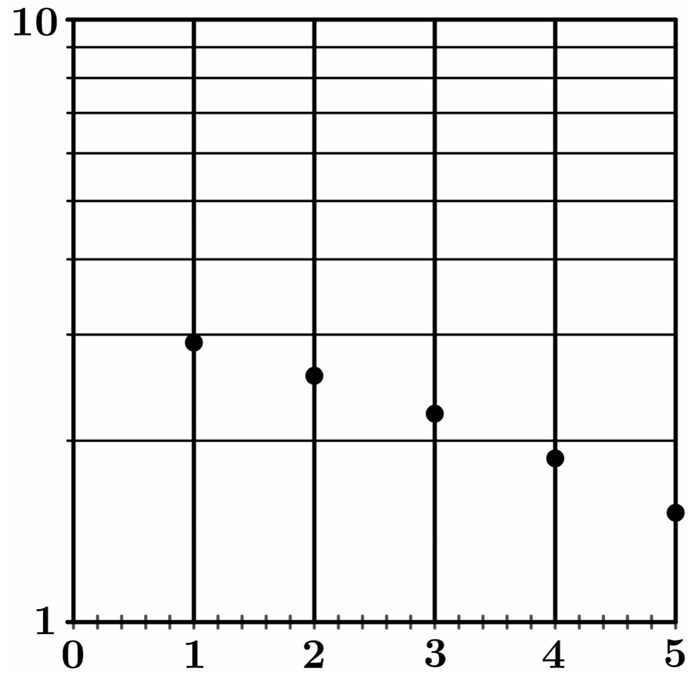
The correct option is (A).
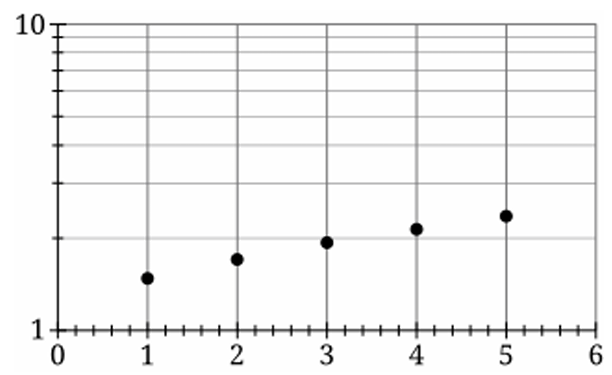
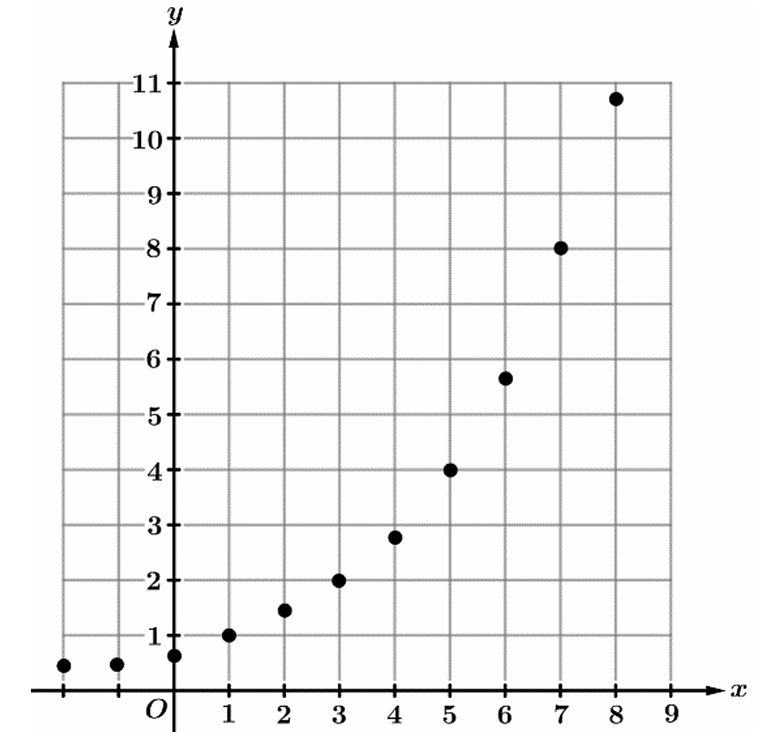
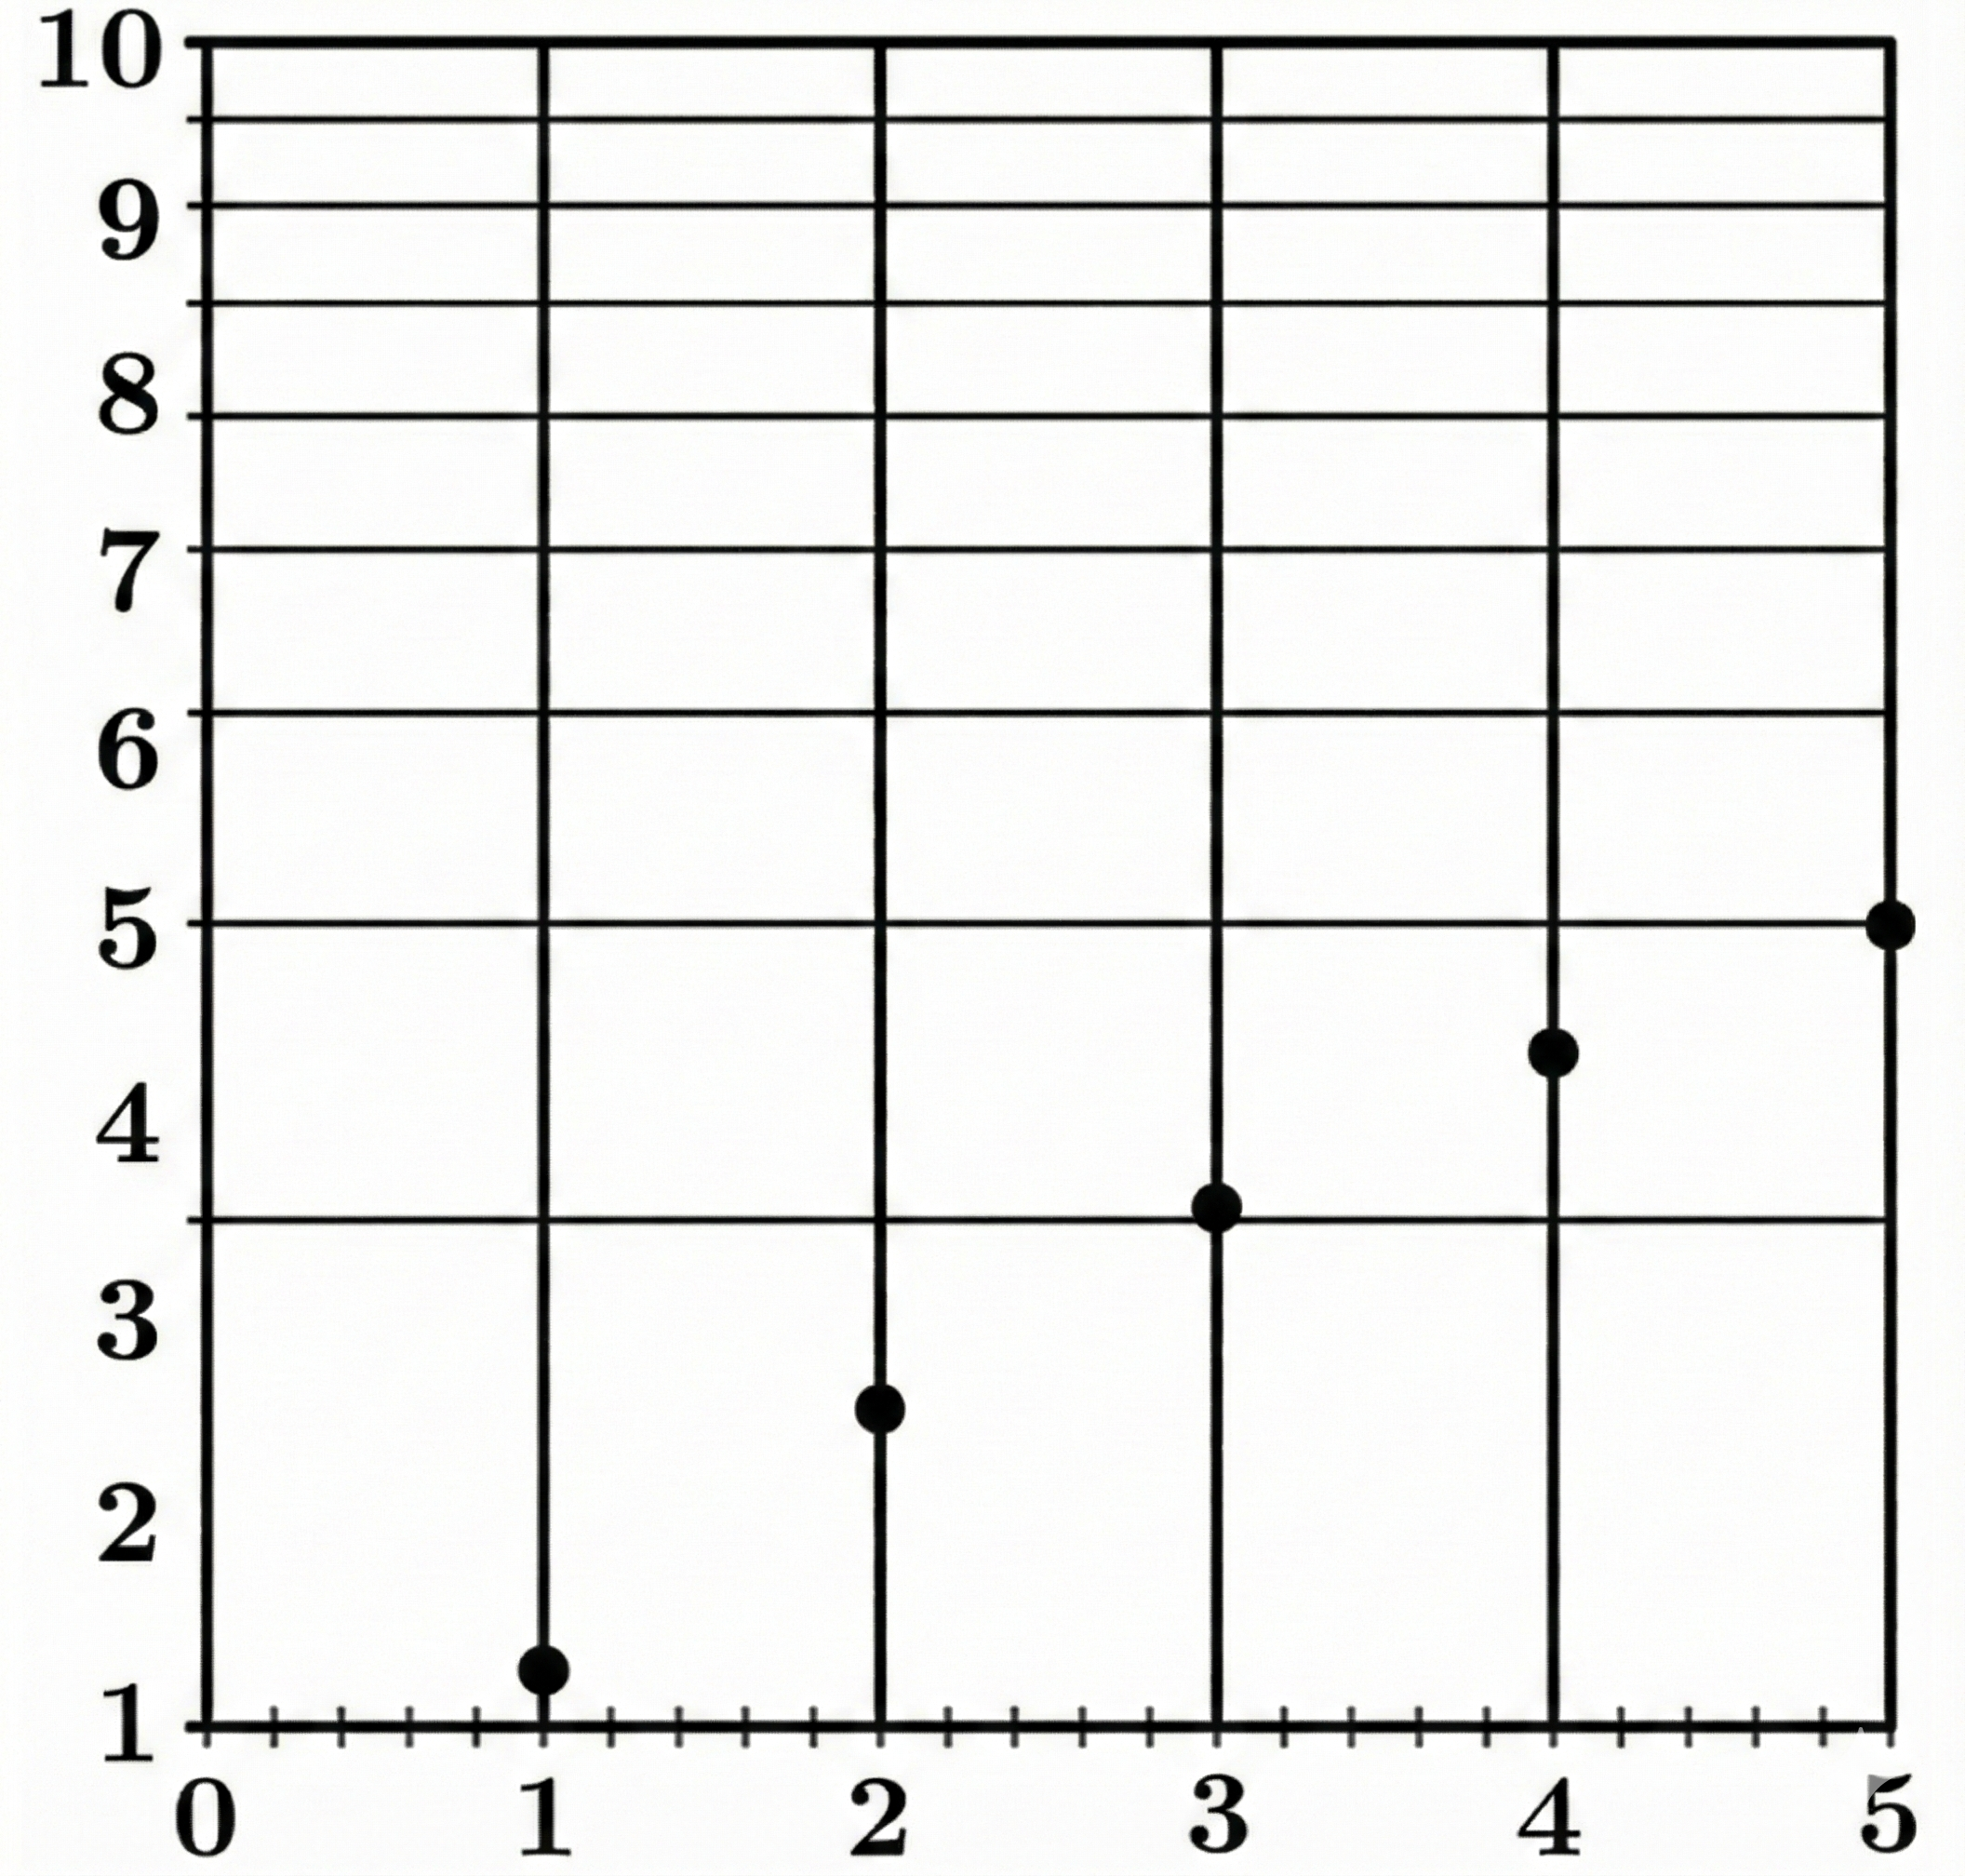
The graphed points show that as \( x \) increases linearly, \( y \) increases by a constant ratio (doubling).
This identifies the function \( f \) as an exponential relationship of the form \( y = a \cdot b^x \).
On a semi-log plot, the vertical axis represents \( \log(y) \) instead of \( y \).
Applying a logarithm to both sides gives \( \log(y) = \log(a) + x \log(b) \).
This equation follows the linear form \( Y = mx + c \), where \( Y = \log(y) \).
Thus, exponential data always appears as a straight line on a semi-logarithmic scale.
▶️ Answer/Explanation
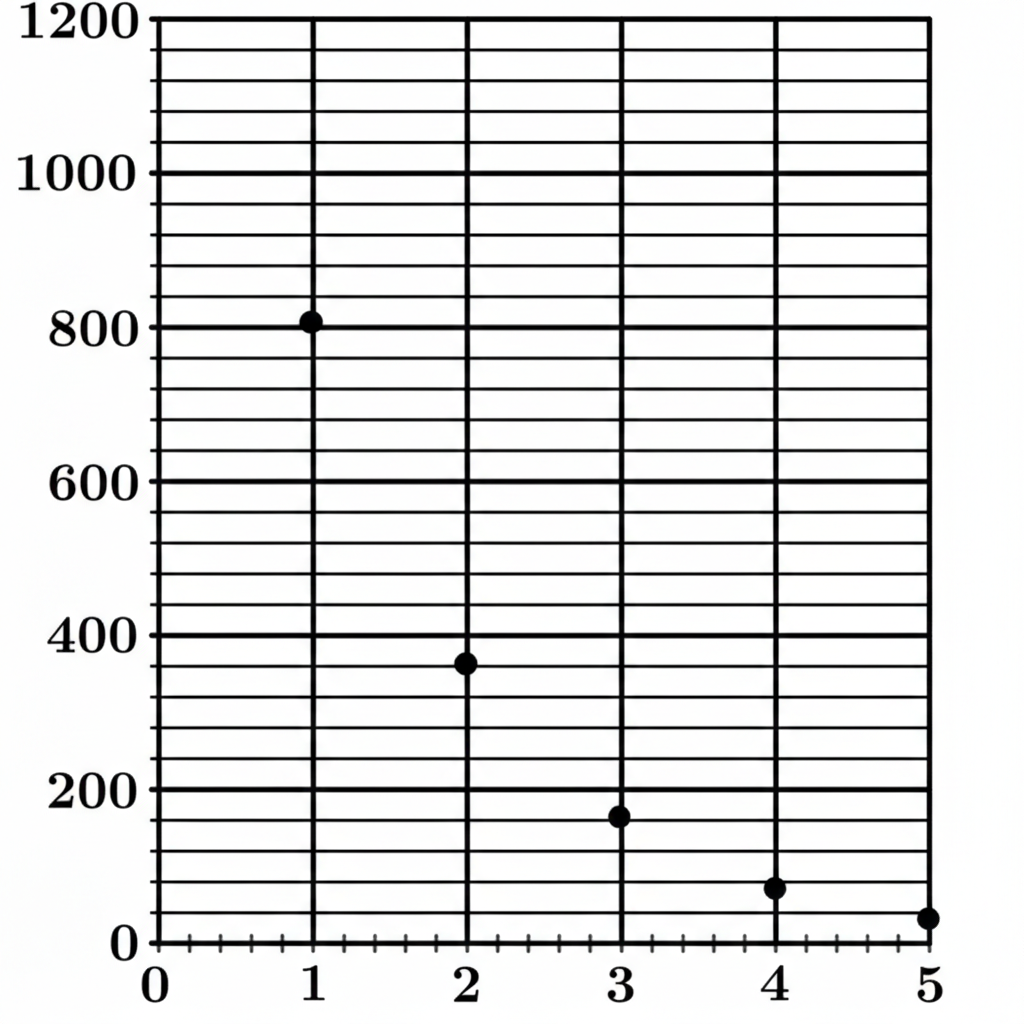
The correct answer is (A).
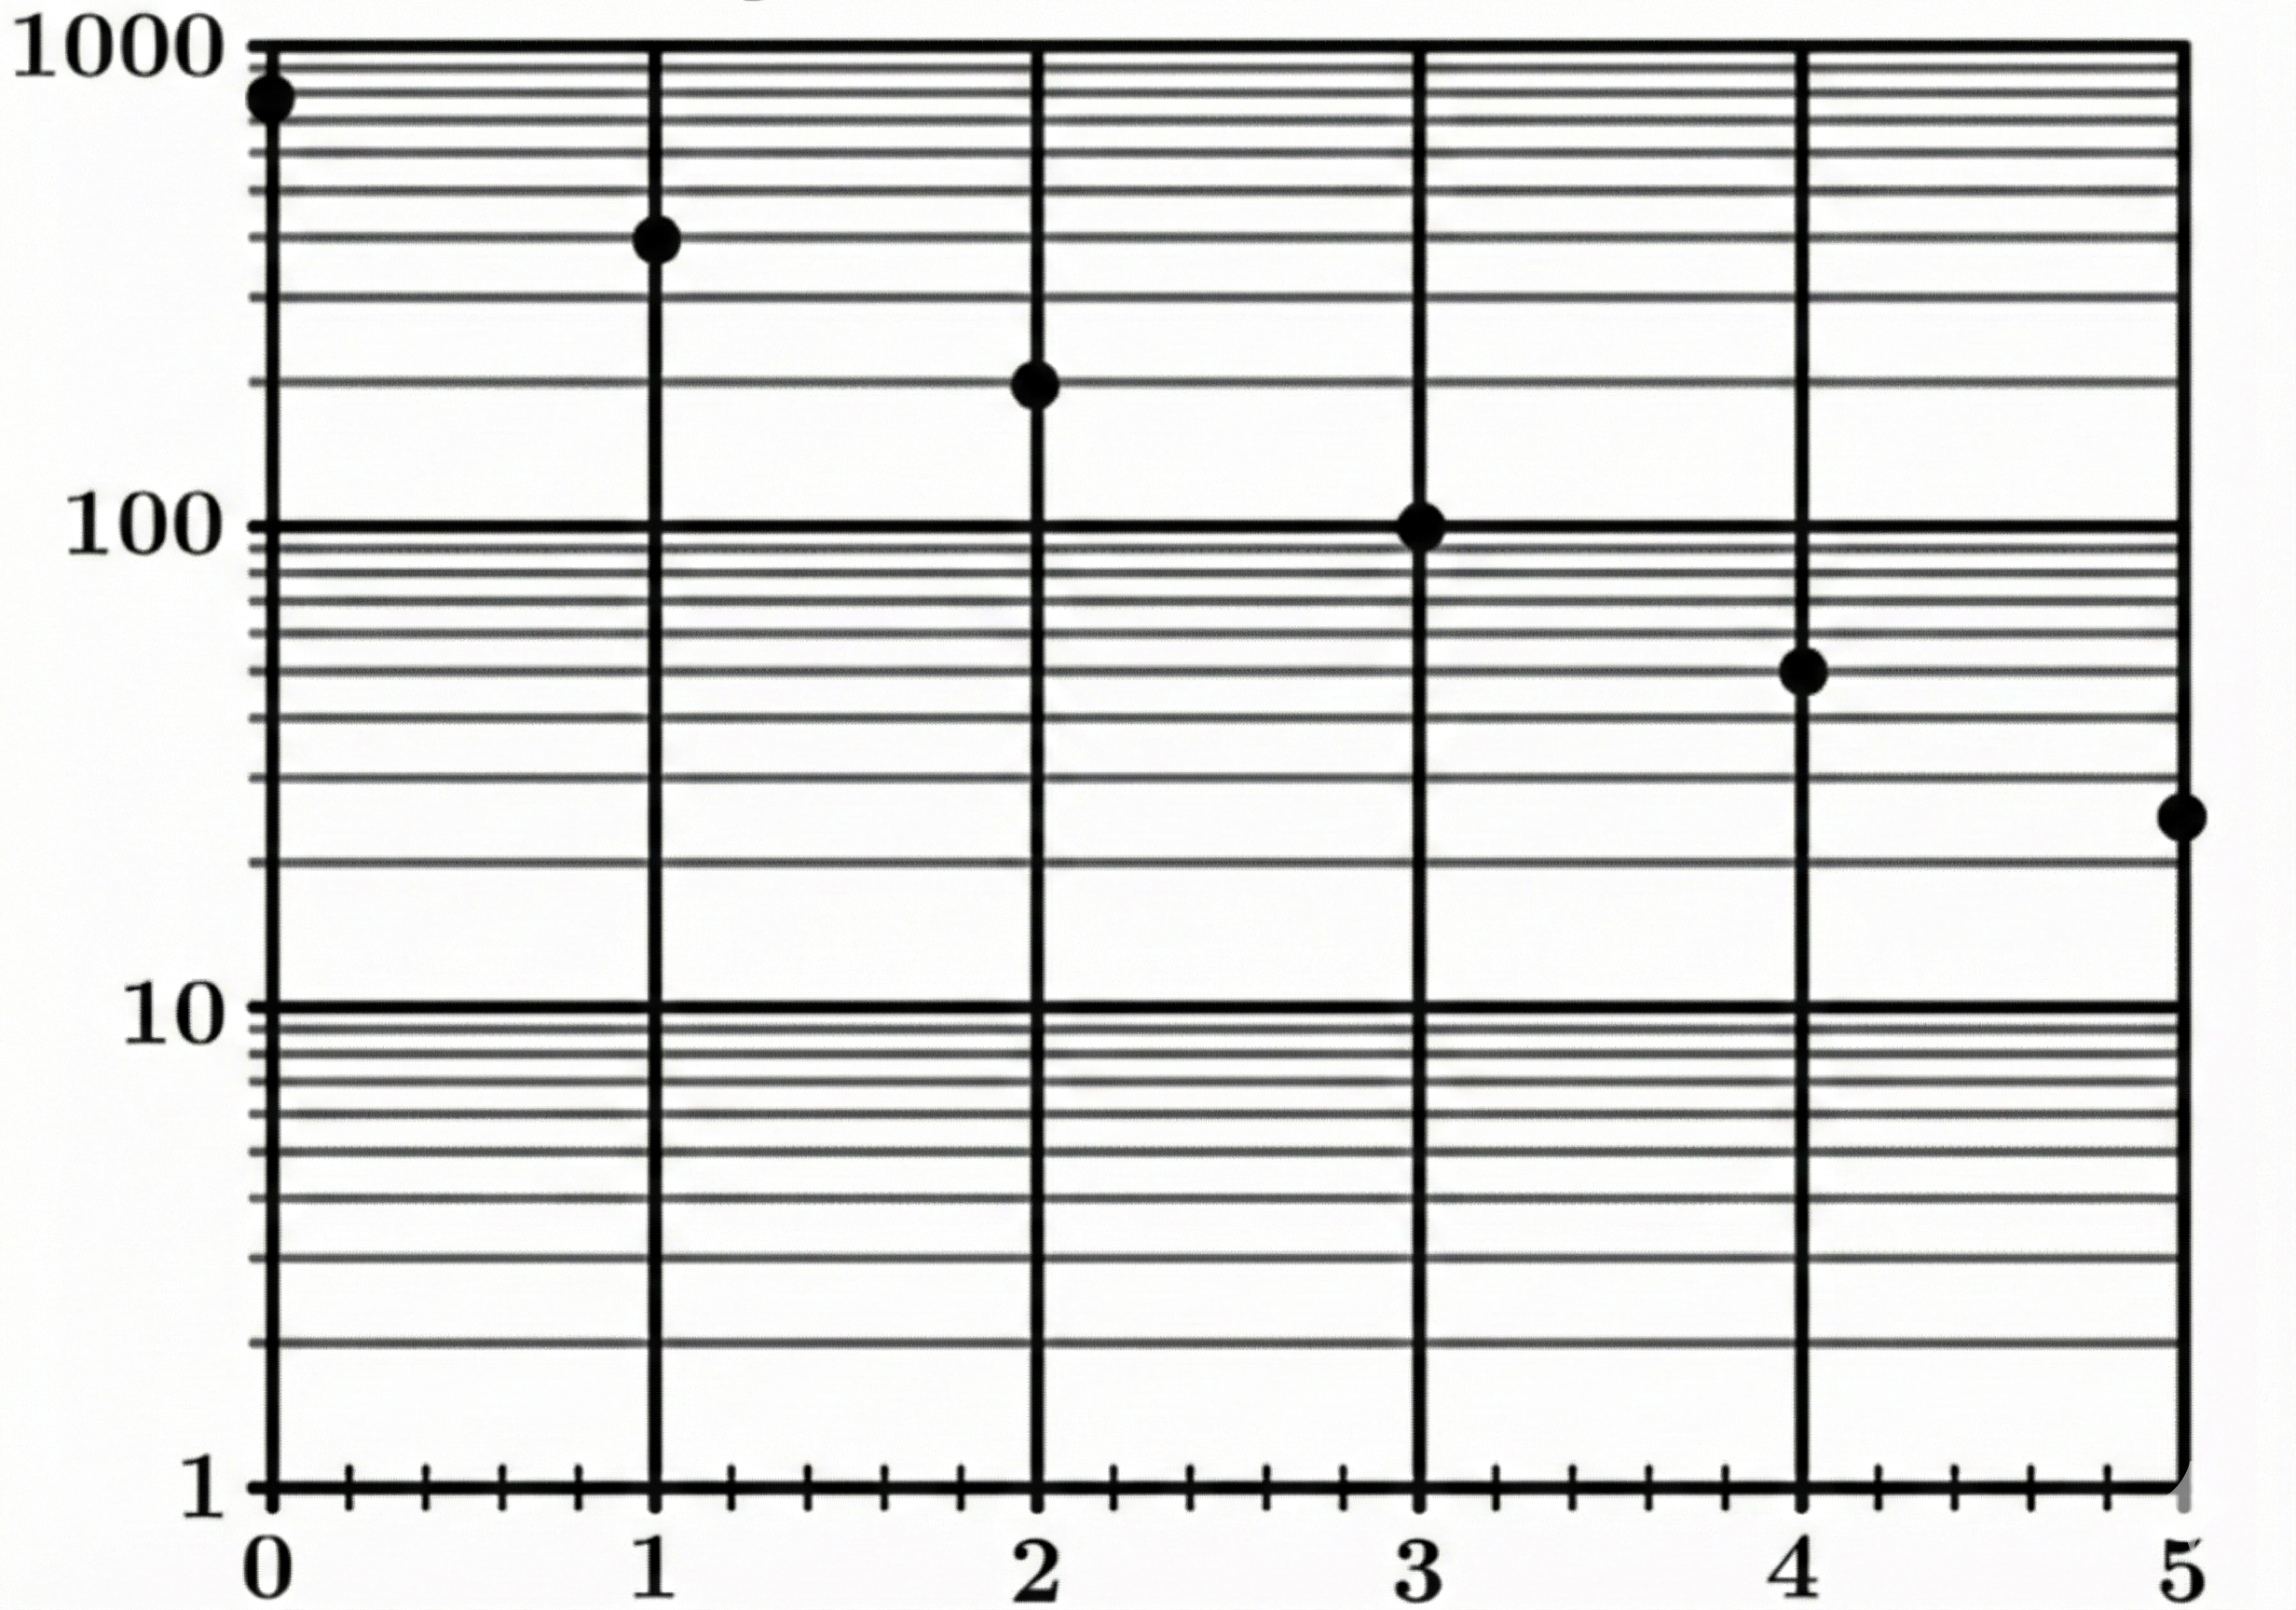
On a semi-log plot, a straight line represents an exponential function of the form $f(x) = ab^x$.
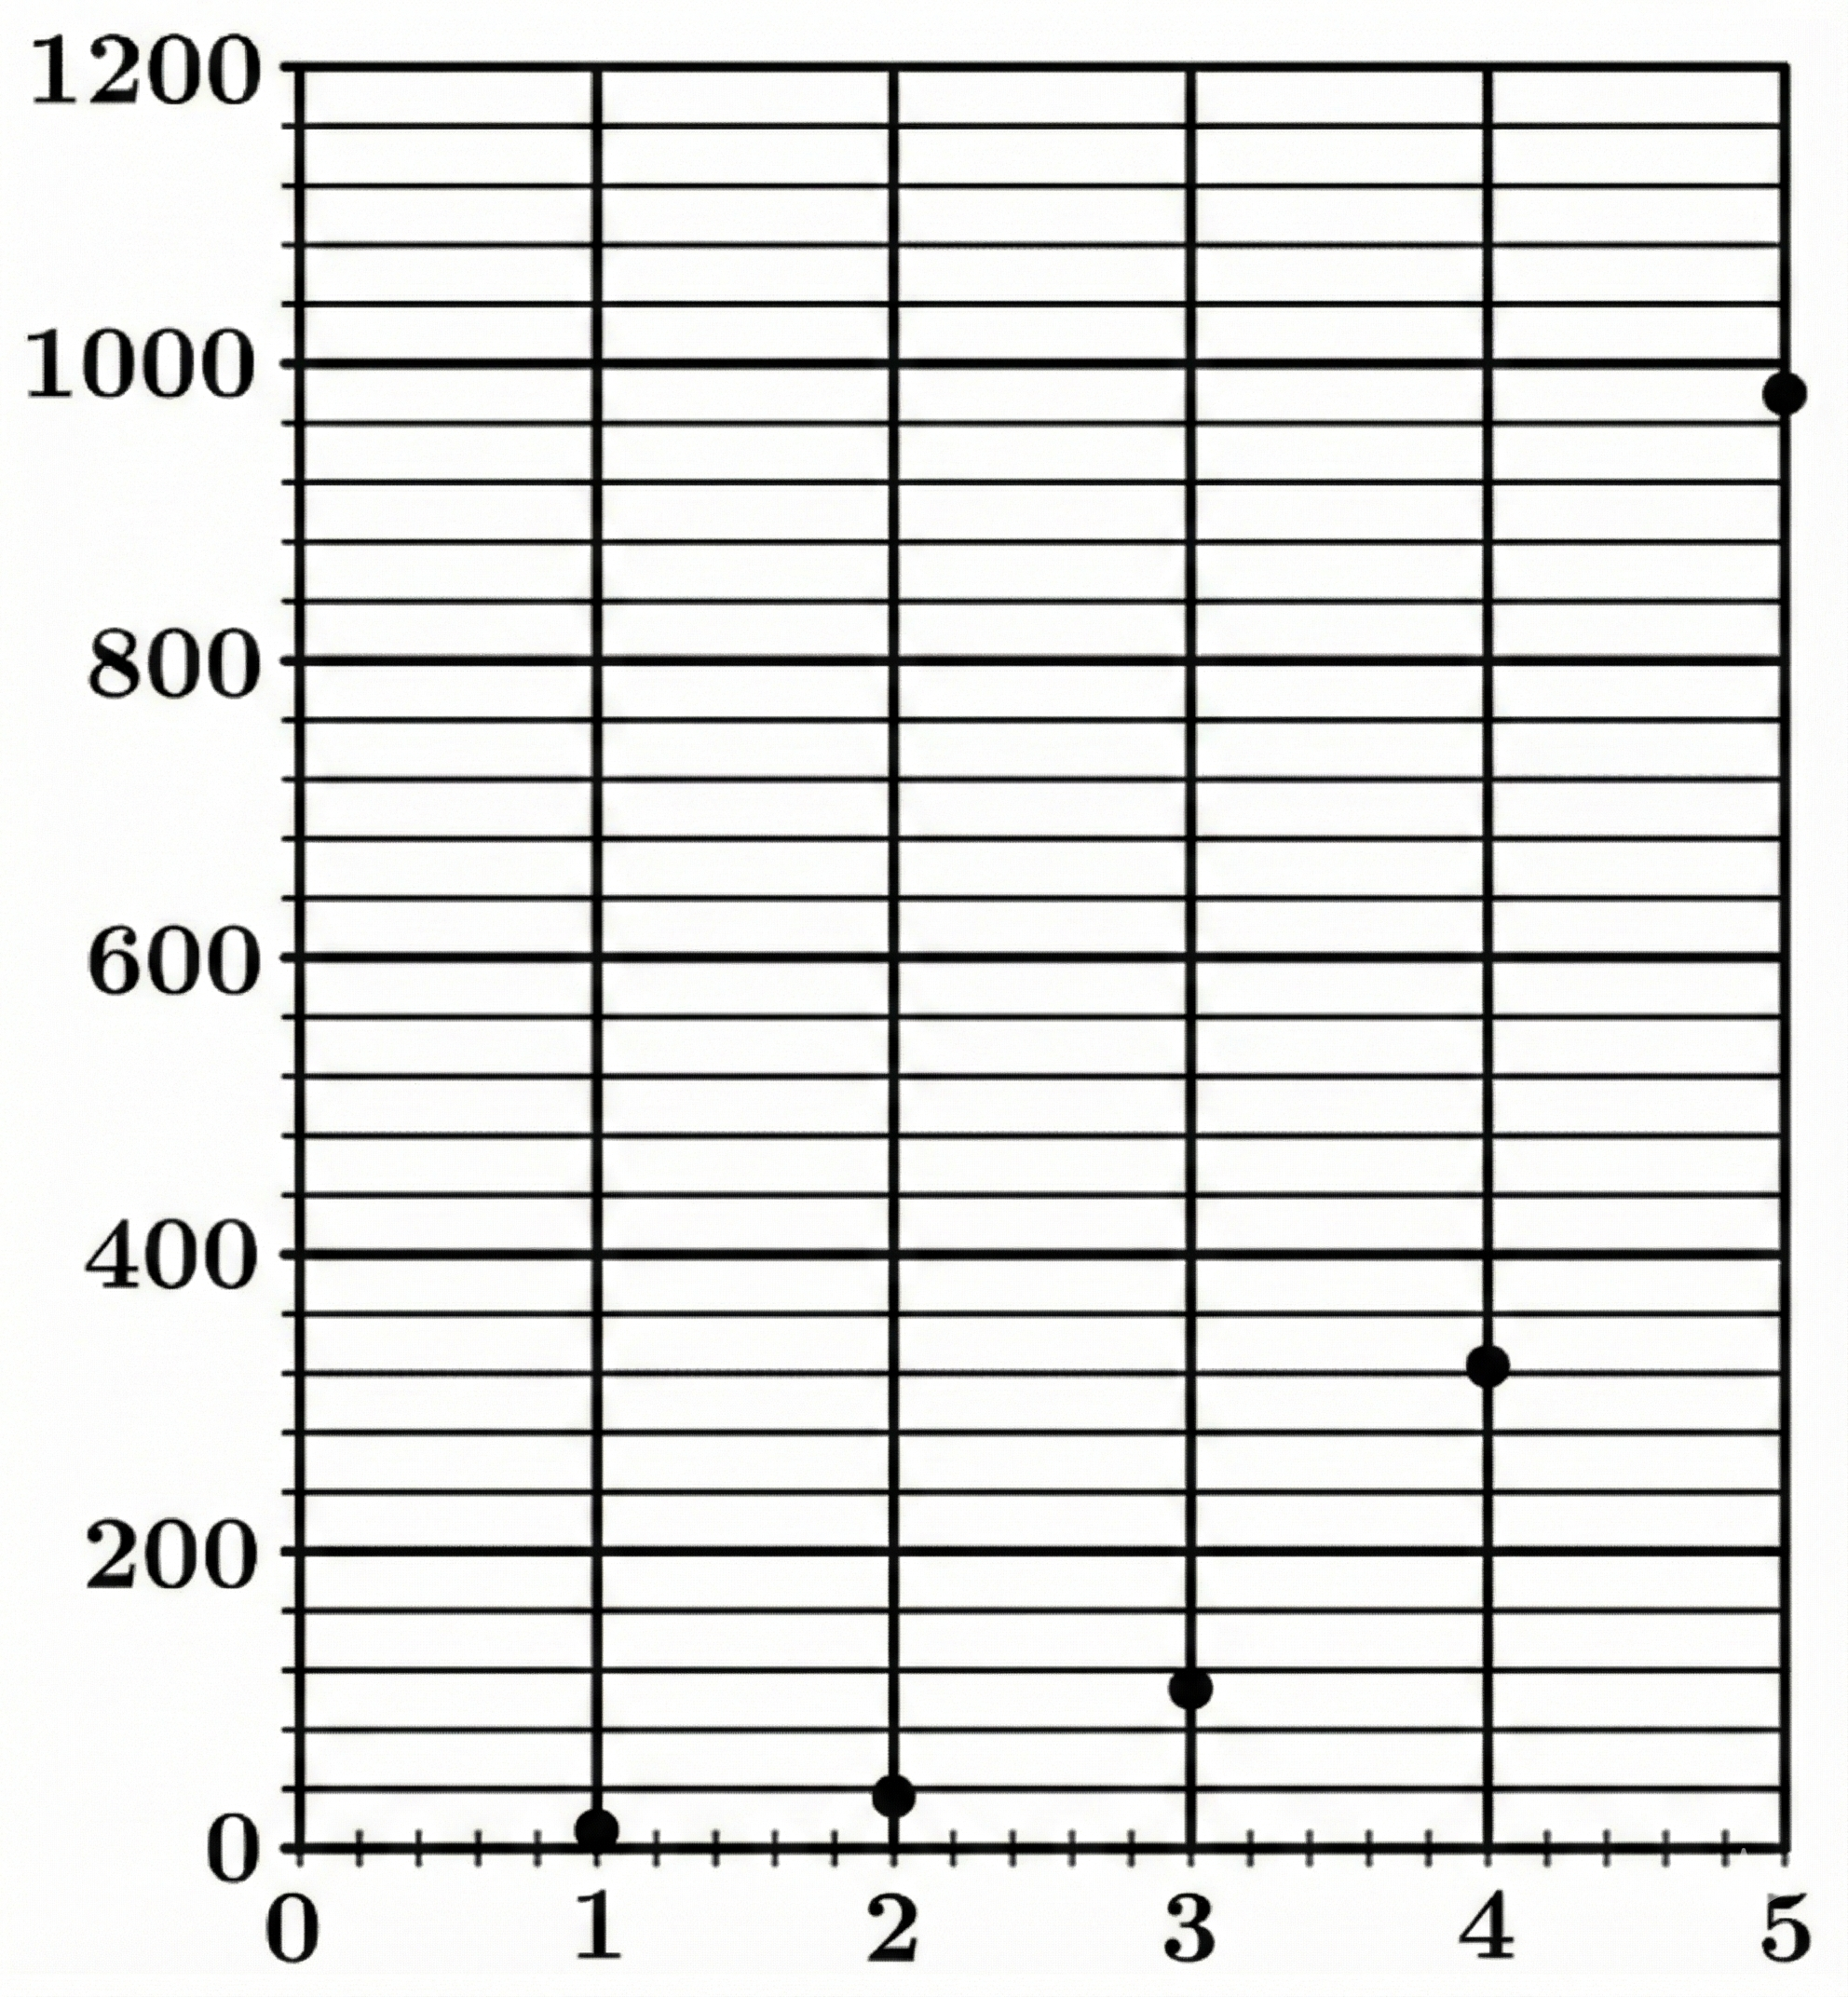
Observing the y-intercept at $x = 0$, the value is slightly below $1000$, which matches the initial value $a = 800$.
As $x$ increases, the $y$ values decrease, indicating an exponential decay where the base $b$ must be less than $1$.
At $x = 1$, the point is at $400$, which satisfies $800 \left( \frac{1}{2} \right)^1 = 400$.
At $x = 3$, the point is at $100$, which satisfies $800 \left( \frac{1}{2} \right)^3 = 800 \cdot \frac{1}{8} = 100$.
Option (C) is linear and (D) is logarithmic, neither of which produces a straight line on a semi-log scale.
▶️ Answer/Explanation
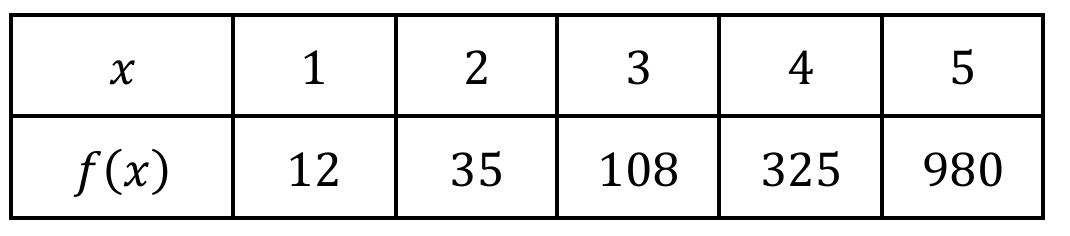
The correct option is (D).
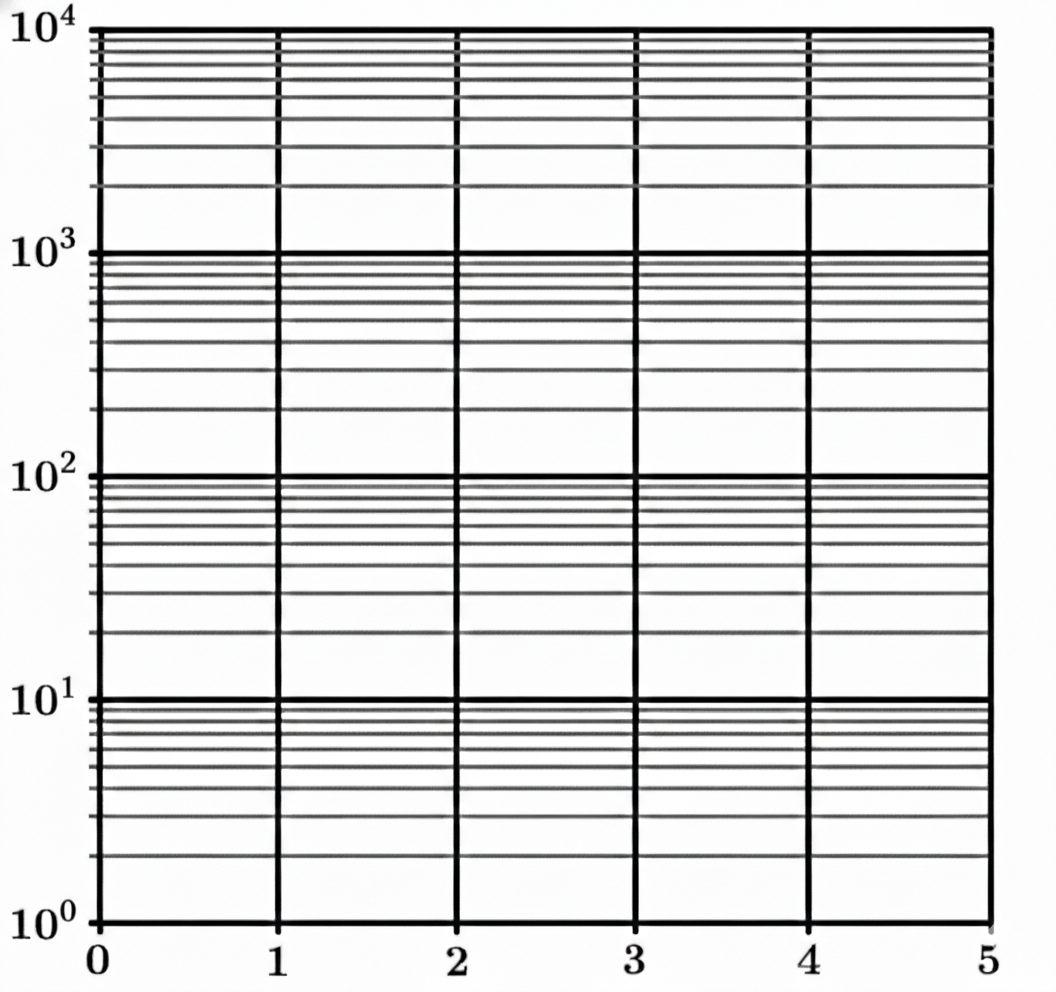
A semi-log plot uses a logarithmic scale for the vertical axis, where increments represent powers of $10$.
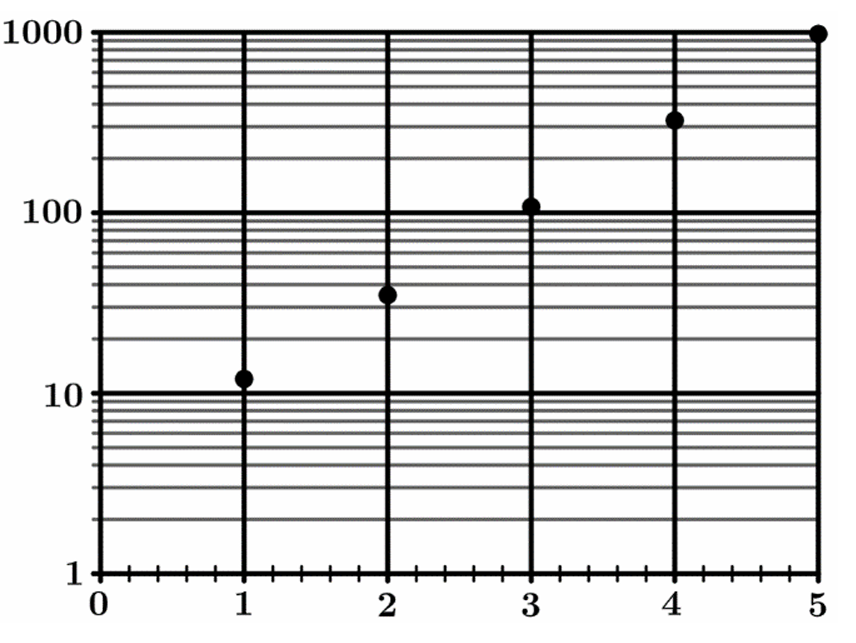
In Graph D, the y-axis labels are $1, 10, 100, 1000$, which indicates a $\log_{10}$ scale.
Plotting the data: at $x=1, f(x)=12$ is just above $10$.
At $x=3, f(x)=108$ is just above $100$.
At $x=5, f(x)=980$ is just below $1000$.
These points form a nearly straight line on the semi-log grid, characteristic of exponential growth.
▶️ Answer/Explanation
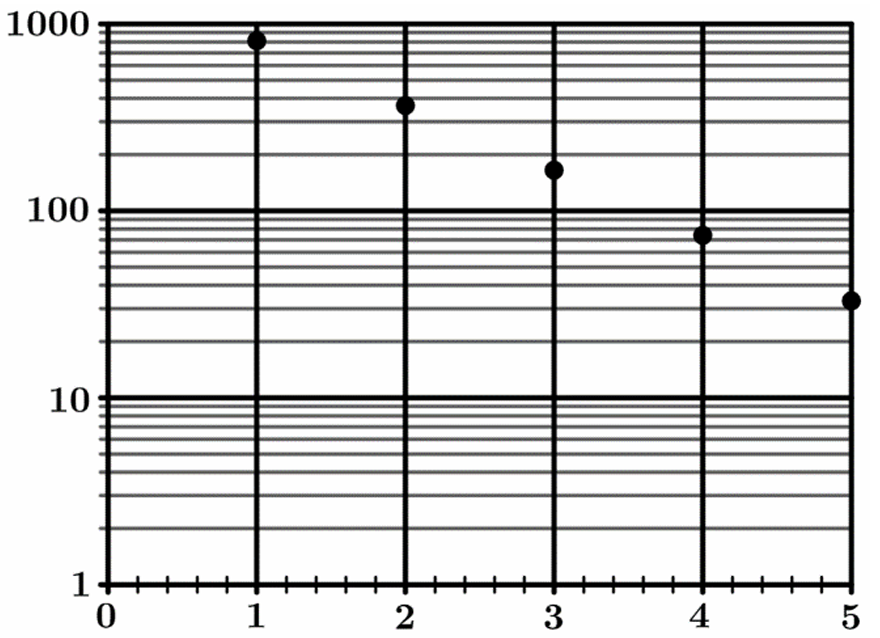
The correct answer is (A).
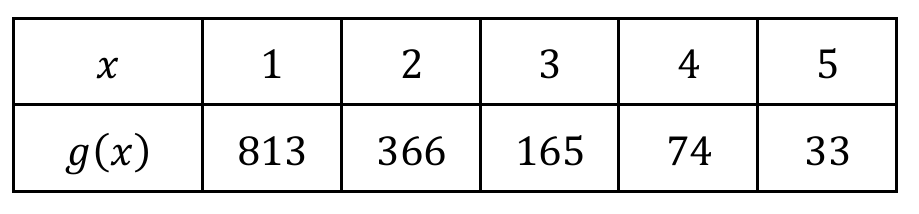
The values of \(g(x)\) decrease by a constant factor of approximately \(0.45\), indicating an exponential function.
In a semi-log plot, an exponential function \(g(x) = ab^x\) appears as a straight line.
The vertical axis in Graph A uses a base-\(10\) logarithmic scale spanning from \(10^0\) to \(10^3\).
Point \((1, 813)\) is correctly placed near the top grid line of \(1000\).
Point \((5, 33)\) is correctly placed between \(10\) and \(100\).
The linear alignment of points in Graph A confirms the relationship \(\log(g(x)) = \log(a) + x\log(b)\).
Options (B), (C), and (D) are incorrect due to improper scaling or the use of linear axes.
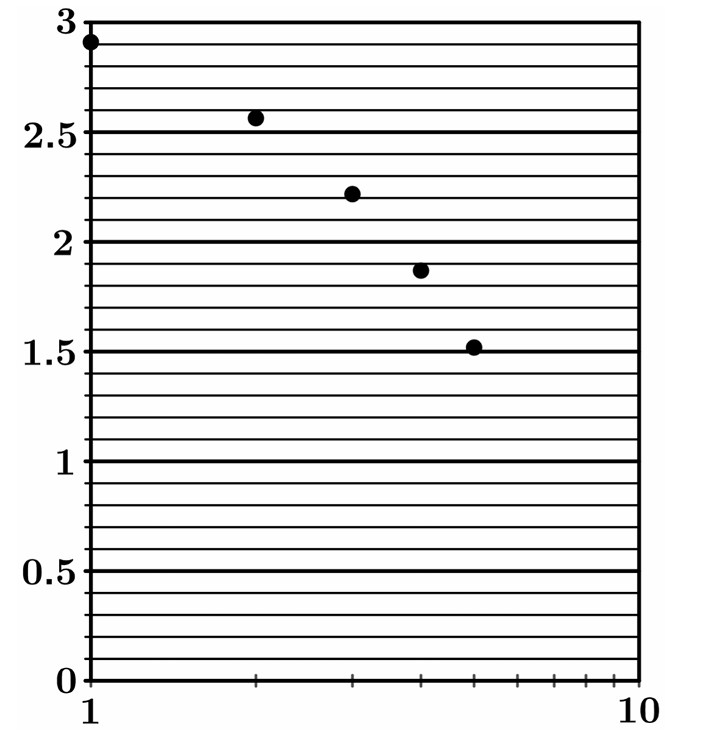
▶️ Answer/Explanation
The correct option is (A).
A straight line on a semi-log plot indicates an exponential relationship between $x$ and $y$.
The linear trend follows the form $\log_{10}(y) = mx + b$, which simplifies to $y = 10^{mx+b}$.
Since the slope $m$ is positive, the data represents exponential growth.
In a standard $xy$-plane, the rate of change of an exponential growth function increases as $x$ increases.
This increasing slope results in a graph that is concave up.
Logarithmic functions, by contrast, would appear linear on a log-log plot or semi-log $x$ plot.
▶️ Answer/Explanation
The correct option is (C).
A straight line on a semi-log plot indicates an exponential relationship between variables.
Since the data points follow a linear trend on the \(\log\) scale, model \(P\) must be exponential.
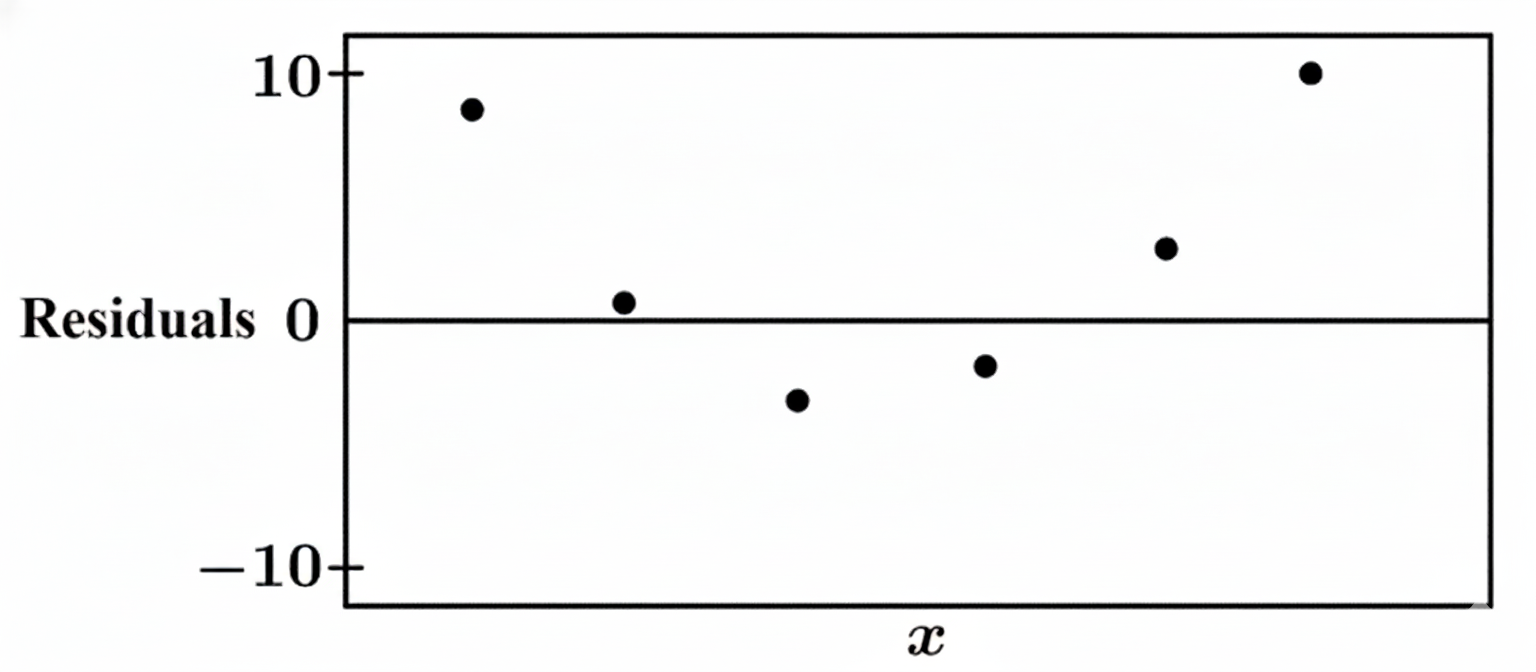
The residual plot shows points randomly scattered around the zero line with no discernible pattern.
A random residual plot confirms that the chosen regression model is appropriate for the data.
Therefore, model \(P\) is exponential and the fit is considered appropriate.