AP Precalculus -2.6 Competing Function Models- FRQ Exam Style Questions - Effective Fall 2023
AP Precalculus -2.6 Competing Function Models- FRQ Exam Style Questions – Effective Fall 2023
AP Precalculus -2.6 Competing Function Models- FRQ Exam Style Questions – AP Precalculus- per latest AP Precalculus Syllabus.
Question
▶️ Answer/Explanation
Part A
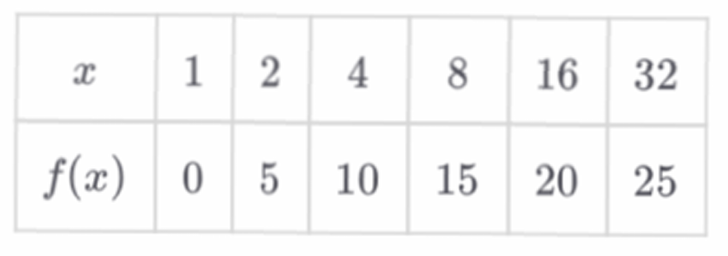
(i) From the table, we find $f(8) = 15$.
Substitute $15$ into the function $g(x)$: $h(8) = g(15) = 0.25(15)^3 – 9.5(15)^2 + 110(15) – 399$.
$h(8) = 0.25(3375) – 9.5(225) + 1650 – 399$.
$h(8) = 843.75 – 2137.5 + 1650 – 399$.
$h(8) = -42.75$.
(ii) To find $f^{-1}(20)$, we look for the $x$ value where $f(x) = 20$.
From the table, $f(16) = 20$.
Therefore, $f^{-1}(20) = 16$.
Part B
(i) We solve the equation $0.25x^3 – 9.5x^2 + 110x – 399 = -45$.
Set the equation to zero: $0.25x^3 – 9.5x^2 + 110x – 354 = 0$.
Using numerical methods or a graphing calculator, the real solutions are approximately:
$x \approx 5.242$
$x \approx 12.188$
$x \approx 20.570$
(ii) The end behavior of a polynomial is determined by its leading term, $0.25x^3$.
Since the leading coefficient is positive and the degree is odd, as $x \to \infty$, $g(x) \to \infty$.
The limit notation is $\lim_{x \to \infty} g(x) = \infty$.
Part C
(i) The function $f$ is best modeled by a logarithmic function.
(ii) In a logarithmic model, constant changes in the output values correspond to proportional changes in the input values.
As the output $f(x)$ increases by a constant $5$ ($0, 5, 10, 15 \dots$),
The input $x$ values are multiplied by a constant factor of $2$ ($1, 2, 4, 8 \dots$).
This constant ratio of inputs for constant additions of outputs is the hallmark of logarithmic growth.
Question
Part A
Part B
Part C
▶️ Answer/Explanation
Part A
(i)
Using the data $M(6) = 508.67$ and $M(12) = 517.50$:
$ab^{(6/12)} = 508.67$ (or $ab^{0.5} = 508.67$)
$ab^{(12/12)} = 517.50$ (or $ab = 517.50$)
(ii)
Divide the second equation by the first: $\frac{ab}{ab^{0.5}} = \frac{517.50}{508.67}$
$b^{0.5} \approx 1.017359…$
$b \approx (1.017359…)^2 \approx 1.035019…$
Using $ab = 517.50 \implies a = \frac{517.50}{1.035019…} \approx 500$
Final values: $a \approx 500.00$ and $b \approx 1.035$
Part B
(i)
$t = -2$ falls in the interval $-10 \le t < 0$, so $M(-2) = 500$.
$t = 12$ is given as $M(12) = 517.50$.
Average Rate of Change $= \frac{M(12) – M(-2)}{12 – (-2)}$
$= \frac{517.50 – 500}{12 + 2}$
$= \frac{17.50}{14} = 1.25$ dollars per month.
(ii)
The linear estimate $A(t)$ uses the point $(12, 517.50)$ and slope $1.25$.
$A(20) = M(12) + 1.25(20 – 12)$
$A(20) = 517.50 + 1.25(8)$
$A(20) = 517.50 + 10 = 527.50$ dollars.
(iii)
The model $M(t)$ for $t \ge 0$ is an exponential function ($b > 1$), which is concave up.
The estimate $A(t)$ is a linear function (a secant line).
Since $M(t)$ is increasing at an increasing rate (exponential growth), the linear model will fall further behind the actual values as $t$ increases.
Part C
The model is only valid as long as the account is open.
Setting $M(t) = 565$ allows us to solve for the maximum value of $t$.
$500(1.035)^{(t/12)} = 565$
This value of $t$ serves as the upper bound (maximum) for the domain of the model $M$.
Question
(A) (i) Use the given data to write two equations that can be used to find the values for constants \(a\) and \(b\) in the expression for \(R(t)\).
(ii) Find the values for \(a\) and \(b\) as decimal approximations.
(B) (i) Use the given data to find the average rate of change in the number of students that have heard the rumor, in students per hour, from \(t=2\) to \(t=6\) hours. Express your answer as a decimal approximation. Show the computations that lead to your answer.
(ii) Interpret the meaning of your answer from (i) in the context of the problem.
(iii) Consider the values that result from using the average rate of change found in (i) to estimate the number of students that have heard the rumor for times \(t=p\) hours, where \(0 < p < 6\). Are these estimates less than or greater than the number of students predicted by the model \(R\) for times \(t=p\) hours? Explain your reasoning using characteristics of the average rate of change and characteristics of the model \(R\).
▶️ Answer/Explanation
Part (A)
(i) Writing the equations:
We are given the following data points:
• At \(t=2\), \(R(2) = 15\).
• At \(t=6\), \(R(6) = 67\).
For \(t=2\), since \(0 \le 2 < 6\), we use the first part of the piecewise function: \(R(t) = 7(a)^{t/2}\).
$$15 = 7(a)^{2/2} \quad \Rightarrow \quad 15 = 7a^1$$
Equation 1: \(15 = 7a\)
For \(t=6\), since \(t \ge 6\), we use the second part of the piecewise function: \(R(t) = -213.29 + b \ln t\).
Equation 2: \(67 = -213.29 + b \ln(6)\)
(ii) Finding the values for \(a\) and \(b\):
From Equation 1:
$$a = \frac{15}{7} \approx 2.1428$$
From Equation 2:
$$67 + 213.29 = b \ln(6)$$
$$280.29 = b \ln(6)$$
$$b = \frac{280.29}{\ln(6)} \approx \frac{280.29}{1.79176} \approx 156.4328$$
Answer: \(a \approx 2.143\), \(b \approx 156.433\)
Part (B)
(i) Average Rate of Change:
The formula for the average rate of change from \(t=2\) to \(t=6\) is:
$$\text{Avg Rate} = \frac{R(6) – R(2)}{6 – 2}$$
Substituting the given values (\(R(6)=67\) and \(R(2)=15\)):
$$\text{Avg Rate} = \frac{67 – 15}{4} = \frac{52}{4} = 13$$
Answer: 13 students per hour.
(ii) Interpretation:
On average, the number of students who have heard the rumor increases by 13 students per hour between the 2nd hour and the 6th hour.
(iii) Estimates vs. Model Prediction:
Answer: The estimates are greater than the number of students predicted by the model.
Reasoning:
• On the interval \(0 < t < 6\), the function \(R(t) = 7(a)^{t/2}\) is an exponential growth function with a base greater than 1.
• Exponential growth functions are concave up (the rate of change is increasing).
• The average rate of change corresponds to the slope of the secant line connecting the points at \(t=2\) and \(t=6\).
• For a concave up curve, the secant line lies above the curve on the interval between the two points. Therefore, linear estimates based on the average rate (secant line) will be greater than the actual function values.
Part (C)
The range values (outputs) of \(R(t)\) represent the number of students. In the context of the problem, this range must be limited in two ways:
1. Population Cap: The number of students who heard the rumor cannot exceed the total student population of the school.
2. Discrete Values: You cannot have a fraction of a student, so strictly speaking, the context implies the range should consist of whole numbers (non-negative integers).
Question
▶️ Answer/Explanation
(A)(i) Equations
Substituting the points \((1, 3)\) and \((5, 89)\) into \(H(t) = ab^t\):
1. \(3 = ab^1\) (or \(3 = ab\))
2. \(89 = ab^5\)
(A)(ii) Values for a and b
Dividing equation 2 by equation 1: \(\frac{ab^5}{ab} = \frac{89}{3} \implies b^4 = 29.67\).
Solving for \(b\): \(b = (29.67)^{0.25} \approx 2.33\).
Solving for \(a\): \(a = \frac{3}{2.33} \approx 1.29\).
(B)(i) Average Rate of Change
\(\text{Rate} = \frac{H(5) – H(1)}{5 – 1} = \frac{89 – 3}{4} = \frac{86}{4} = 21.5\)
Answer: 21.5 feet per week.
(B)(ii) Interpretation
The answer indicates that between the first and fifth weeks, the bamboo tree grew at an average speed of 21.5 feet per week.
(B)(iii) Comparison
Greater. The function represents exponential growth (\(b > 1\)), which is concave up. This means the rate of growth increases over time, so the rate after week 5 will be steeper than the rate before week 5.
(C) Confidence
\(t = 4\) weeks.
The biologists should be more confident in \(t=4\) because it is an interpolation (within the observed data range). \(t=11\) is an extrapolation; biological growth cannot remain exponential indefinitely, so the model is likely inaccurate that far out.