Constructing Linear, Quadratic, and Exponential Models from Data
When two variables in a data set are related, the relationship can often be modeled using a linear, quadratic, or exponential function.
If the rate of change is approximately constant, a linear model is appropriate. If the rate of change itself is changing at an approximately constant rate, a quadratic model may be suitable. If the output values change by a constant ratio over equal-length input intervals, an exponential model is appropriate.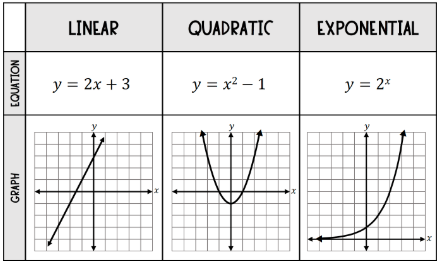
Common model forms are:
Linear model: \( \mathrm{ \displaystyle f(x) = mx + b } \)
Quadratic model: \( \mathrm{ \displaystyle f(x) = ax^2 + bx + c } \)
Exponential model: \( \mathrm{ \displaystyle f(x) = ab^x } \)
Different models can be constructed for the same data set and then compared using contextual clues, such as expected long-term behavior, realism of predictions, and whether the situation involves additive or multiplicative change.
The most appropriate model is the one that best represents both the numerical pattern in the data and the real-world context.
Example
The following data shows the distance traveled by a car over time:
Time (hours): \( \mathrm{0,\;1,\;2,\;3} \)
Distance (km): \( \mathrm{0,\;60,\;120,\;180} \)
Construct an appropriate model.
▶️ Answer/Explanation
The distance increases by 60 km each hour.
The rate of change is constant, so a linear model is appropriate.
Slope: \( \mathrm{m = 60} \)
Initial value: \( \mathrm{b = 0} \)
\( \mathrm{ \displaystyle f(t) = 60t } \)
Conclusion
A linear model best represents the data.
Example
The following data shows the height of a ball thrown upward:
Time (seconds): \( \mathrm{0,\;1,\;2,\;3} \)
Height (meters): \( \mathrm{1,\;6,\;9,\;10} \)
Determine which model is most appropriate.
▶️ Answer/Explanation
First differences: \( \mathrm{5,\;3,\;1} \)
Second differences: \( \mathrm{-2,\;-2} \)
Since the second differences are approximately constant, the data follows a quadratic pattern.
The motion of a thrown object is also consistent with a quadratic model.
Conclusion
A quadratic model is the most appropriate for this data set.
Validating a Model Constructed from a Data Set
After a model is constructed from a data set, it must be validated to determine whether it is appropriate for representing the relationship between the variables.
One important method for validation is analyzing the residuals of the model.
A residual is the difference between the actual value and the predicted value given by the model:
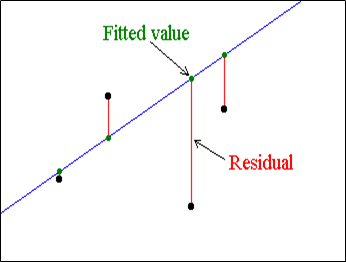
\( \mathrm{ \displaystyle \text{Residual} = \text{Actual value} – \text{Predicted value} } \)
A graph of the residuals versus the input values is called a residual plot.
A model is justified as appropriate if the residual plot:
• Appears randomly scattered around zero
• Shows no clear pattern or trend
If a pattern is present in the residual plot, the model may not be suitable and a different type of model should be considered.
The error in a model refers to the difference between predicted and actual values. Depending on the context, it may be more appropriate for a model to underestimate or overestimate values over certain intervals.
For example, safety-related models may prefer overestimation, while budget-related models may prefer underestimation.
Example
A linear regression model is used to predict monthly electricity usage. A residual plot is created and shows points scattered randomly above and below zero.
▶️ Answer/Explanation
Because the residuals show no visible pattern, the model errors appear random.
This indicates that the linear model appropriately captures the relationship in the data.
Conclusion
The model is validated and reasonable for prediction.
Example
A quadratic regression model is used to predict the height of a projectile. The residual plot shows a clear curved pattern.
▶️ Answer/Explanation
A visible pattern in the residual plot indicates that the model does not fully account for the structure in the data.
This suggests that a different model or additional factors may be needed.
Conclusion
The model is not well validated and should be reconsidered.