Graphs of Polar Functions
A function written in polar form as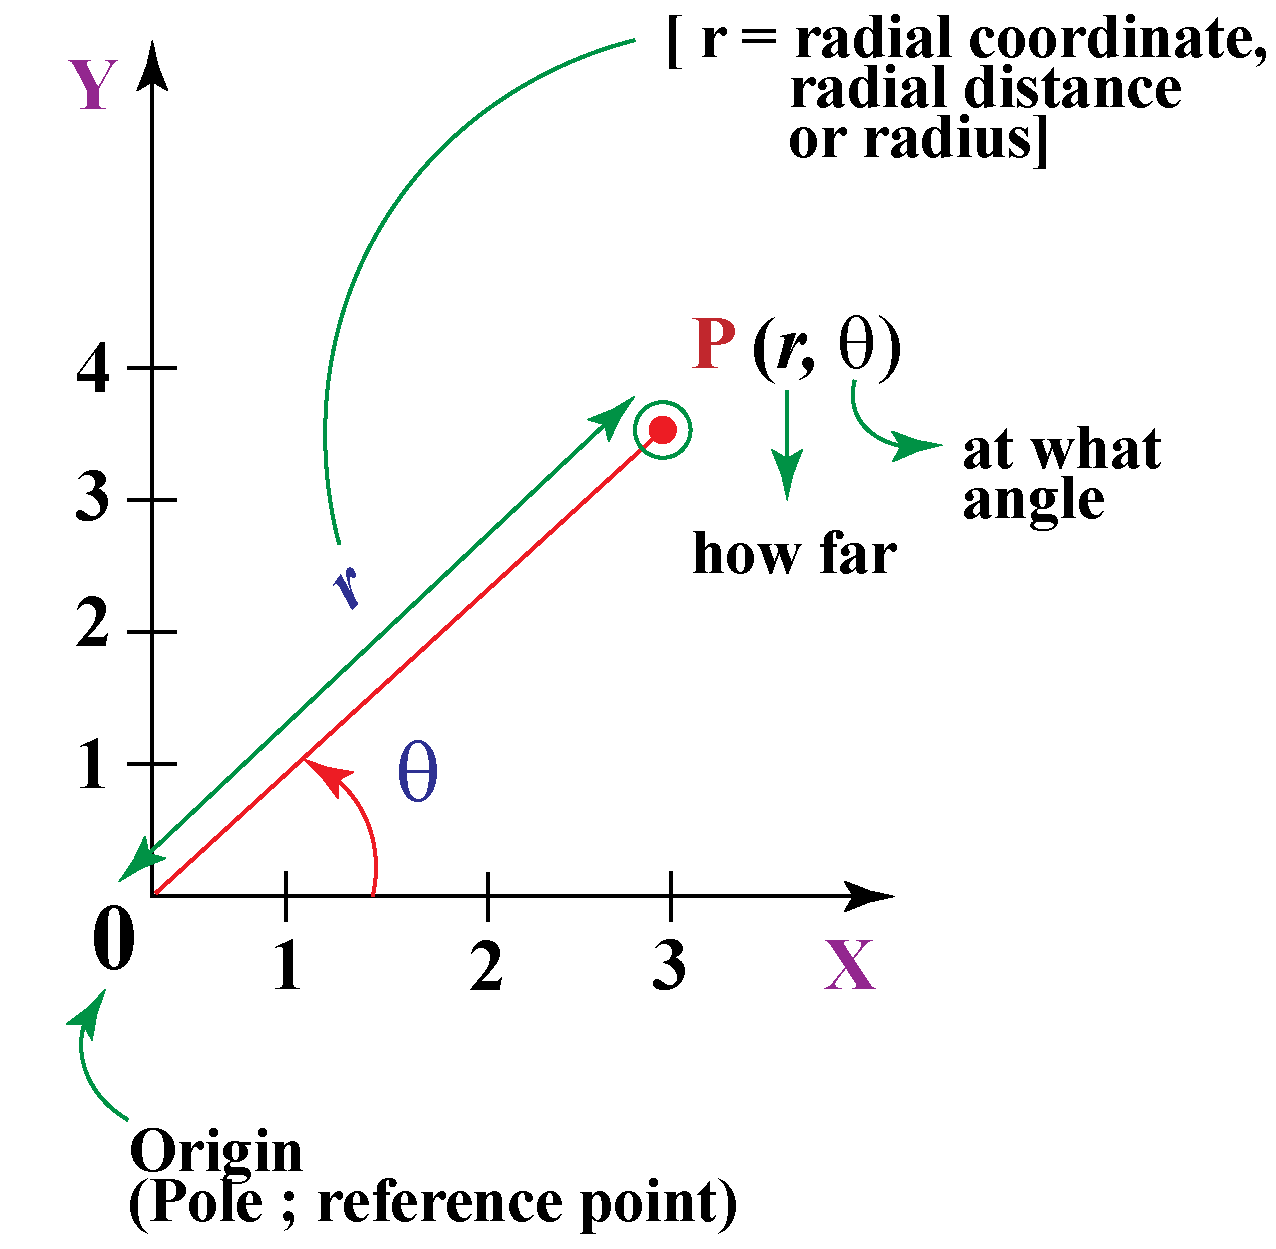
\( r = f(\theta) \)
defines a relationship between an angle measure and a radius.
The graph of a polar function consists of input–output pairs where:
the input values are angles \( \theta \)
the output values are radii \( r \)
For each angle \( \theta \), the value \( r \) determines how far from the origin the point lies along the terminal ray of angle \( \theta \).
As \( \theta \) varies, the set of points \( (r, \theta) \) traces out a curve in the plane.
If \( r \) is negative for a given angle, the point is plotted in the opposite direction along the terminal ray, which can affect the shape of the graph.
Example:
Consider the polar function
\( r = 2 \).
Describe the graph of this function.
▶️ Answer/Explanation
For every angle \( \theta \), the radius is constant and equal to 2.
This means all points are exactly 2 units from the origin.

Conclusion: The graph is a circle of radius 2 centered at the origin.
Example:
Consider the polar function
\( r = 2\cos \theta \).
Explain how the graph is formed.
▶️ Answer/Explanation
For each angle \( \theta \), the radius depends on the value of \( \cos \theta \).
When \( \cos \theta \) is positive, the point lies in the direction of \( \theta \).
When \( \cos \theta = 0 \), the point lies at the origin.
When \( \cos \theta \) is negative, the point is plotted in the opposite direction.
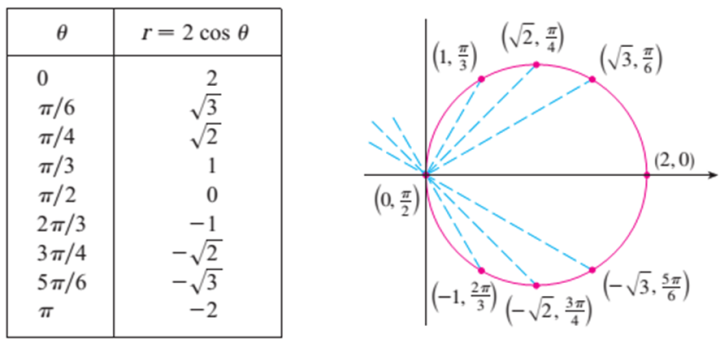
Conclusion: The graph traces a curve determined by how the radius changes as the angle changes.
Restricting the Domain of a Polar Function from Its Graph
A polar function written as \( r = f(\theta) \) is graphed by plotting points determined by angle–radius pairs \( (\theta, r) \).
When the graph of a polar function is given, the domain of the function refers to the set of angle values \( \theta \) for which points on the graph are included.
The domain can be restricted to show only a desired portion of the graph by selecting:
a starting angle and an ending angle
the corresponding radii at those angles
Restricting the domain is especially useful when focusing on a single loop, petal, or segment of a polar graph.
Only the points traced as \( \theta \) varies over the chosen interval are included in the restricted graph.
Example:
The graph of the polar function \( r = 2\cos \theta \) is shown.
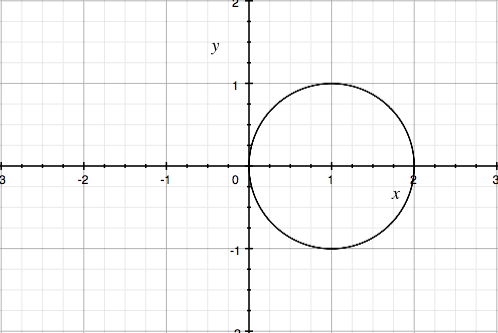
Explain how to restrict the domain to graph only the portion where \( r \ge 0 \).
▶️ Answer/Explanation
The radius is nonnegative when
\( \cos \theta \ge 0 \)
This occurs for
\( -\dfrac{\pi}{2} \le \theta \le \dfrac{\pi}{2} \)
Restricting the domain to this interval includes only the desired portion of the graph.
Conclusion: The restricted domain is \( \left[-\dfrac{\pi}{2}, \dfrac{\pi}{2}\right] \).
Example:
A polar graph forms a single loop as \( \theta \) increases from \( 0 \) to \( \pi \).
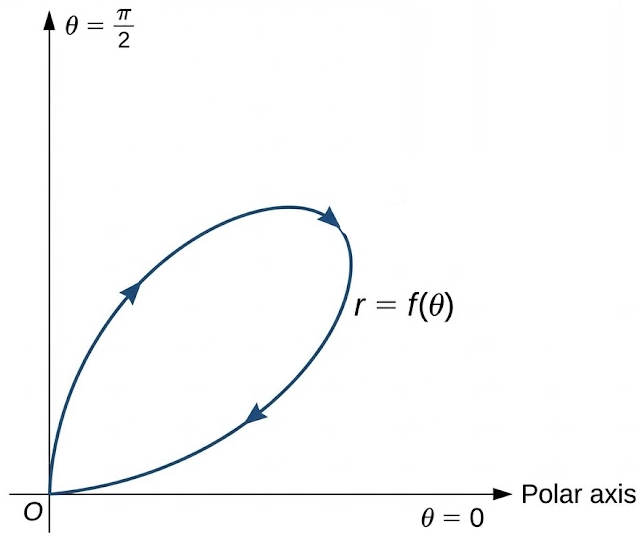
Explain how the domain is restricted to show only this loop.
▶️ Answer/Explanation
The loop begins at the angle \( \theta = 0 \) and ends when the graph returns to its starting position at \( \theta = \pi \).
Restricting the domain to
\( 0 \le \theta \le \pi \)
ensures that only this loop is included in the graph.
Conclusion: Domain restrictions select specific portions of a polar graph based on angle endpoints.
Interpreting Input and Output Changes in Polar Graphs
When graphing a polar function written as 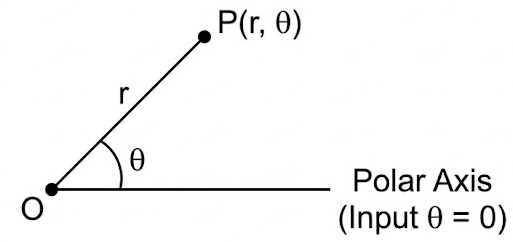
\( r = f(\theta) \)
the input values and output values have clear geometric meanings.
Input Values
Changes in the input variable \( \theta \) correspond to changes in the angle measure from the positive x-axis.
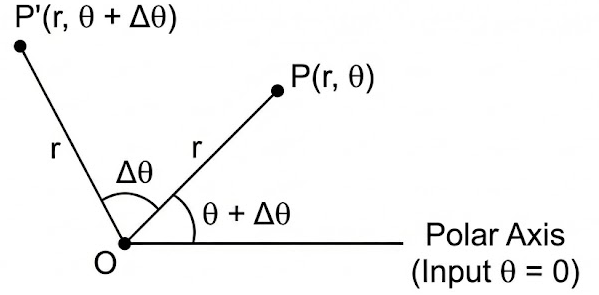
As \( \theta \) increases or decreases, the terminal ray rotates about the origin.
Output Values
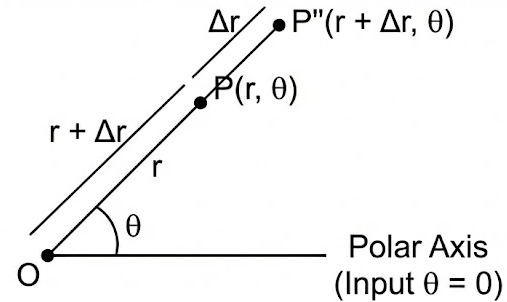
Changes in the output value \( r \) correspond to changes in the distance from the origin.
A larger value of \( r \) places the point farther from the origin, while a smaller value places the point closer to the origin.
If \( r \) is negative, the point is plotted in the direction opposite the terminal ray of angle \( \theta \).
Together, these changes determine the shape and direction of the polar graph.
Example:
Describe the polar function
\( r = \theta \), for \( 0 \le \theta \le 2\pi \).
▶️ Answer/Explanation
As \( \theta \) increases, the angle from the positive x-axis increases.
At the same time, the value of \( r \) increases.
This causes the point to rotate around the origin while moving farther away.
| Change in Input \( \theta \) | Effect on Output \( r \) | Result on Curve |
|---|---|---|
| \( \theta \) increases | \( r \) increases proportionally | Point moves outward while rotating |
| \( \theta = 0 \) | \( r = 0 \) | Curve starts at the origin |
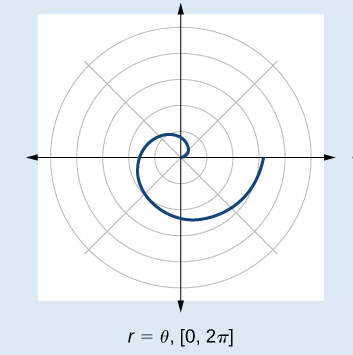
Conclusion: The graph forms an outward spiral.
Example:
Describe how changes in \( \theta \) and \( r \) affect the graph of
\( r = 3\cos \theta \).
▶️ Answer/Explanation
As \( \theta \) changes, the direction of the point rotates.
The value of \( r \) changes according to the cosine of the angle.
Key calculation:
\( r = 3\cos\theta \Rightarrow r^2 = 3r\cos\theta \)
Using \( r^2 = x^2 + y^2 \) and \( r\cos\theta = x \),
\( x^2 + y^2 = 3x \)
This represents a circle of radius \( \dfrac{3}{2} \) with centre at \( \left(\dfrac{3}{2},\,0\right) \).
| Change in Input \( \theta \) | Value of \( \cos \theta \) | Effect on Curve |
|---|---|---|
| \( \theta = 0 \) | Maximum | Farthest point from origin |
| \( \theta = \dfrac{\pi}{2} \) | 0 | Point lies at the origin |
| \( \cos \theta < 0 \) | Negative | Curve reflects across the origin |
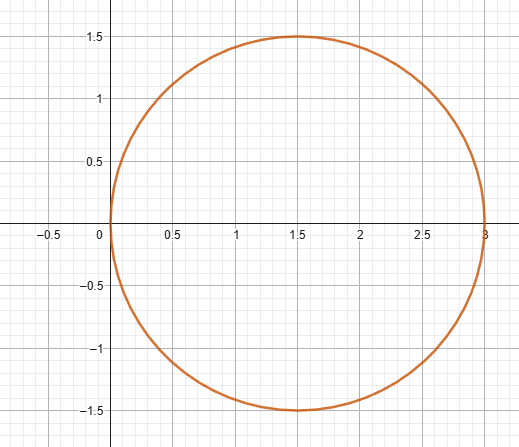
Conclusion: The interaction between angle and radius forms a circle symmetric about the polar axis.
Example:
Describe how changes in \( \theta \) and \( r \) affect the graph of
\( r = 3\sin 2\theta \).
▶️ Answer/Explanation
As \( \theta \) changes, the angle \( 2\theta \) changes twice as fast, causing the curve to repeat more frequently.
The value of \( r \) depends on \( \sin 2\theta \), so both positive and negative values of \( r \) occur.
Key points:
When \( \sin 2\theta = 1 \), \( r = 3 \) (maximum radius).
When \( \sin 2\theta = 0 \), \( r = 0 \), so the curve passes through the origin.
Negative values of \( r \) reflect points through the origin, forming additional petals.
| Value of \( \theta \) | \( \sin 2\theta \) | Effect on Curve |
|---|---|---|
| \( 0 \) | 0 | Curve starts at the origin |
| \( \dfrac{\pi}{4} \) | 1 | Maximum petal length |
| \( \dfrac{\pi}{2} \) | 0 | Returns to the origin |
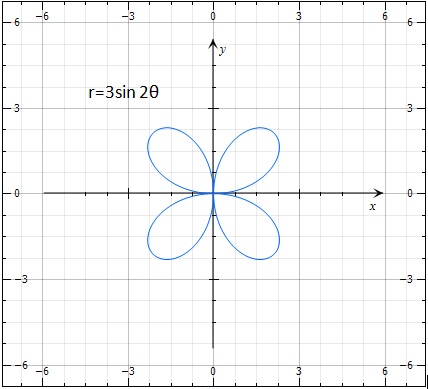
Conclusion: The factor \( 2\theta \) causes the graph to form a four-petaled rose, with petals evenly spaced around the origin.