Distance from the Origin in Polar Functions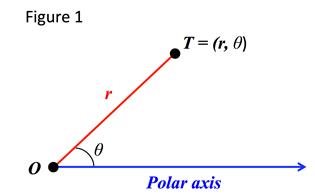
For a polar function written as
\( r = f(\theta) \)
the value of \( r \) determines the distance of the point from the origin, regardless of direction.
If the function \( f(\theta) \) is:
positive and increasing, or
negative and decreasing
then the distance between the point and the origin is increasing.
This is because the distance from the origin depends on the magnitude \( |r| \), not the sign of \( r \).
In both cases, the absolute value \( |f(\theta)| \) increases, so the point moves farther away from the origin as \( \theta \) changes.
Example:
Consider the polar function
\( r = \theta \), for \( 0 \le \theta \le 2 \).
▶️ Answer/Explanation
For this interval, \( r = \theta \) is positive and increasing.
As \( \theta \) increases, the value of \( r \) increases.
Therefore, the distance from the origin increases.
Conclusion: The graph moves outward from the origin as \( \theta \) increases.
Example:
Consider the polar function
\( r = -\theta \), for \( 0 \le \theta \le 2 \).
▶️ Answer/Explanation
For this interval, \( r \) is negative and decreasing.
As \( \theta \) increases, the value of \( r \) becomes more negative.
The magnitude \( |r| \) increases, even though the sign is negative.
Conclusion: The distance from the origin increases, and the graph moves outward in the opposite direction of the angle.
Decreasing Distance from the Origin in Polar Functions
For a polar function written as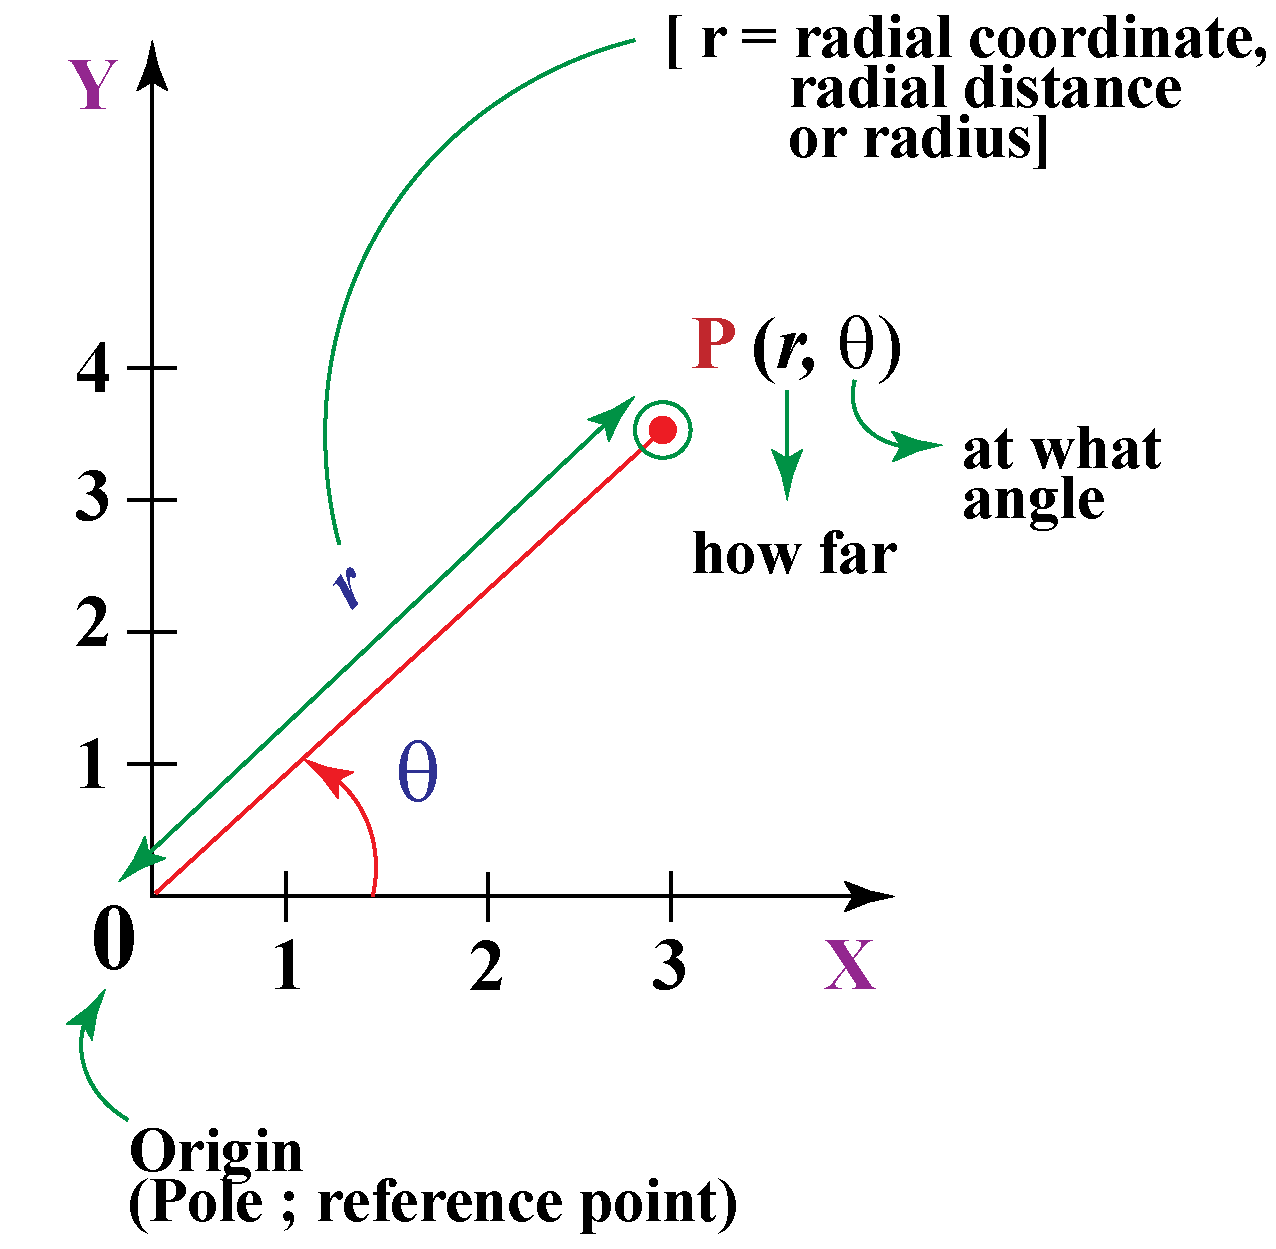
\( r = f(\theta) \)
the distance of the point from the origin is determined by the magnitude \( |r| \).
If the function \( f(\theta) \) is:
positive and decreasing, or
negative and increasing
then the distance between the point and the origin is decreasing.
In both cases, the absolute value \( |f(\theta)| \) decreases as \( \theta \) changes, so the point moves closer to the origin.
This behavior affects how the curve approaches or moves away from the origin as the angle varies.
Example:
Consider the polar function
\( r = 3 – \theta \), for \( 0 \le \theta \le 3 \).
▶️ Answer/Explanation
For this interval, \( r \) is positive and decreasing.
As \( \theta \) increases, the value of \( r \) decreases.
Therefore, the distance from the origin decreases.
Conclusion: The graph moves inward toward the origin.
Example:
Consider the polar function
\( r = -4 + \theta \), for \( 0 \le \theta \le 4 \).
▶️ Answer/Explanation
For this interval, \( r \) is negative and increasing.
As \( \theta \) increases, the value of \( r \) becomes less negative.
The magnitude \( |r| \) decreases.
Conclusion: The distance from the origin decreases as the point moves inward.
Relative Extrema in Polar Functions
For a polar function written as
\( r = f(\theta) \)
the value of \( r \) determines the distance from the origin.
If the function \( f(\theta) \) changes behavior on an interval, important geometric features appear in the graph.
Relative Extrema
If a polar function:
changes from increasing to decreasing, or
changes from decreasing to increasing
then the function has a relative extremum on that interval.
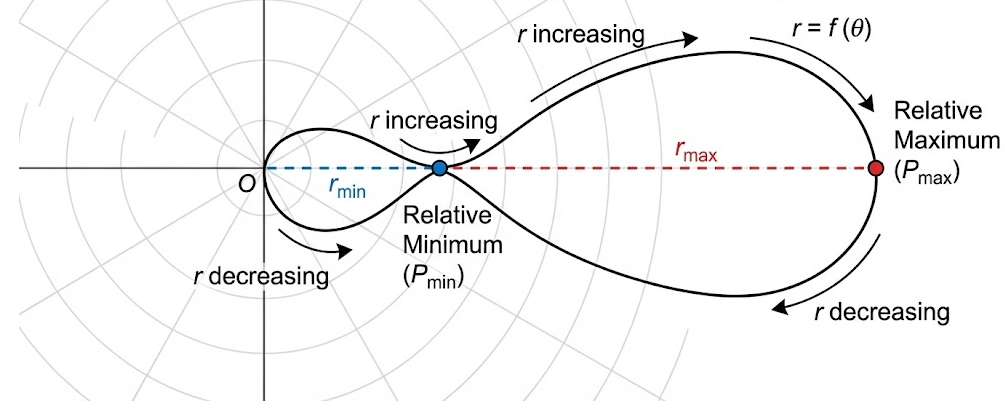
Geometrically:
a relative maximum of \( r \) corresponds to a point that is relatively farthest from the origin
a relative minimum of \( r \) corresponds to a point that is relatively closest to the origin
These points often mark turning points such as the tips of petals or the nearest approach of the graph to the origin.
Example:
Consider the polar function
\( r = 2 + \cos \theta \).
Describe the relative extremum.
▶️ Answer/Explanation
The function \( \cos \theta \) increases and then decreases over its period.
When \( \cos \theta = 1 \), the value of \( r \) is largest:
\( r = 2 + 1 = 3 \)
This corresponds to a point farthest from the origin.
When \( \cos \theta = -1 \), the value of \( r \) is smallest:
\( r = 2 – 1 = 1 \)
Conclusion: The graph has a relative maximum distance of 3 and a relative minimum distance of 1 from the origin.
Example:
A polar function increases for \( 0 \le \theta \le \dfrac{\pi}{2} \) and decreases for \( \dfrac{\pi}{2} \le \theta \le \pi \).
Explain what happens at \( \theta = \dfrac{\pi}{2} \).
▶️ Answer/Explanation
At \( \theta = \dfrac{\pi}{2} \), the function changes from increasing to decreasing.
This indicates a relative maximum of \( r \).
Geometrically, this point is the location on the graph that is relatively farthest from the origin.
Conclusion: The polar graph has a turning point corresponding to a relative extremum in distance from the origin.
Average Rate of Change in Polar Functions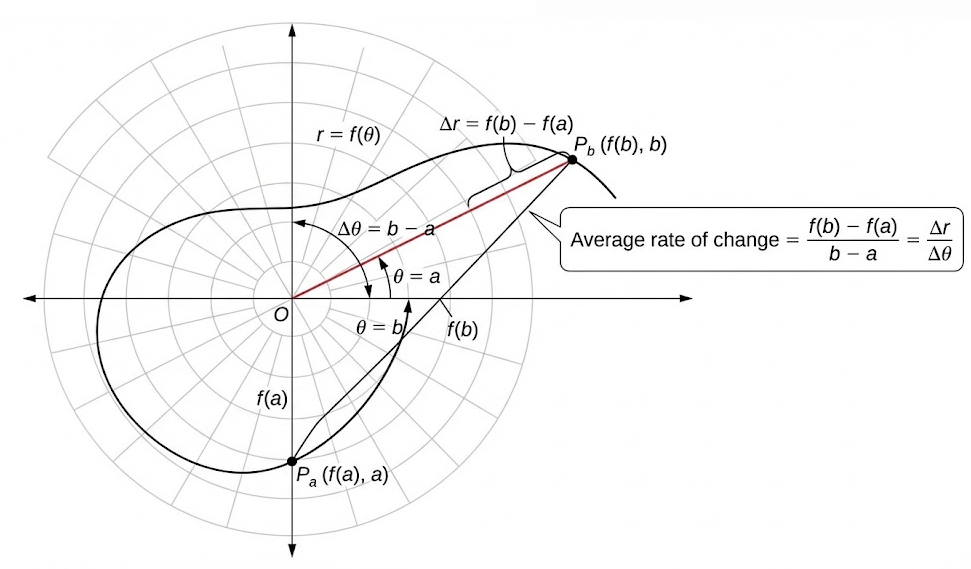
For a polar function written as
\( r = f(\theta) \)
the average rate of change of \( r \) with respect to \( \theta \) over an interval of \( \theta \) measures how the radius changes as the angle changes.
Over the interval from \( \theta = a \) to \( \theta = b \), the average rate of change is given by
\( \text{Average rate of change} = \dfrac{f(b) – f(a)}{b – a} \)
This ratio compares the change in radius to the change in angle.
Graphically, the average rate of change indicates how quickly the point on the polar graph is moving away from or toward the origin per radian of rotation.
A positive average rate of change means the radius is increasing on average, while a negative value means the radius is decreasing on average over the interval.
Example:
Find the average rate of change of the polar function
\( r = 2\theta \)
over the interval \( 0 \le \theta \le \pi \).
▶️ Answer/Explanation
Compute the radius values:
\( f(\pi) = 2\pi \)
\( f(0) = 0 \)
Apply the average rate of change formula:
\( \dfrac{2\pi – 0}{\pi – 0} = 2 \)
Conclusion: The radius increases at an average rate of 2 units per radian.
Example:
Find the average rate of change of the polar function
\( r = 3 – \theta \)
over the interval \( 1 \le \theta \le 3 \).
▶️ Answer/Explanation
Compute the radius values:
\( f(3) = 0 \)
\( f(1) = 2 \)
Apply the average rate of change formula:
\( \dfrac{0 – 2}{3 – 1} = -1 \)
Conclusion: The radius decreases at an average rate of 1 unit per radian.
Using Average Rate of Change to Estimate Values in Polar Functions
For a polar function written as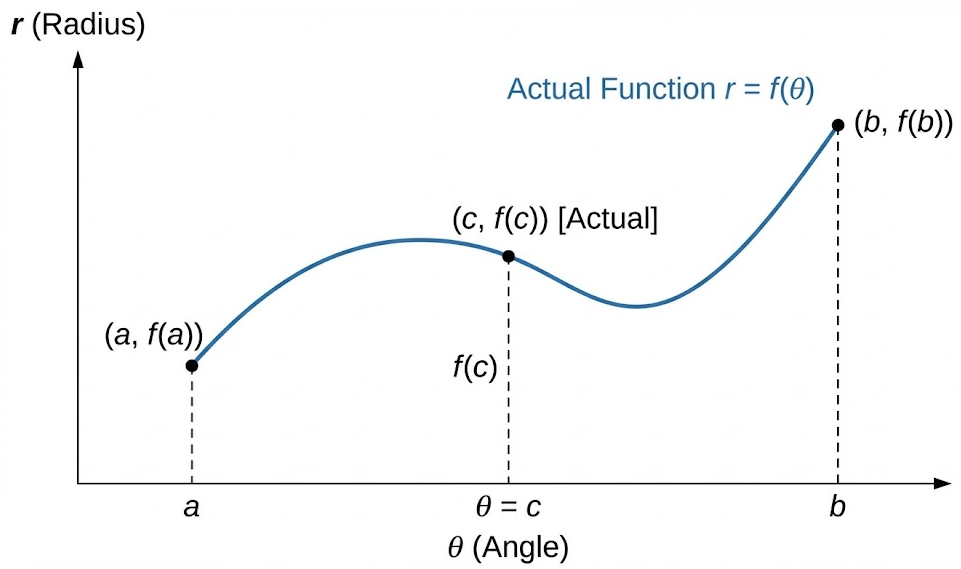
\( r = f(\theta) \)
the average rate of change of \( r \) with respect to \( \theta \) over an interval provides a way to estimate radius values within that interval.
Over an interval from \( \theta = a \) to \( \theta = b \), the average rate of change is
\( \dfrac{f(b) – f(a)}{b – a} \)
This represents the slope of the secant line on the graph of \( r \) versus \( \theta \).
Assuming the rate of change is approximately constant over the interval, the value of the function at a point \( \theta = c \) within the interval can be estimated by
\( f(c) \approx f(a) + \dfrac{f(b) – f(a)}{b – a}(c – a) \)
This approximation treats the function as linear between \( a \) and \( b \).
Example:
The polar function \( r = f(\theta) \) satisfies \( f(1) = 2 \) and \( f(3) = 6 \).
Estimate the value of \( f(2) \).
▶️ Answer/Explanation
First find the average rate of change over \( [1, 3] \):
\( \dfrac{6 – 2}{3 – 1} = 2 \)
Now estimate \( f(2) \):
\( f(2) \approx 2 + 2(2 – 1) = 4 \)
Conclusion: The estimated radius at \( \theta = 2 \) is 4.
Example:
The polar function \( r = 5 – \theta \) is defined for \( 1 \le \theta \le 3 \).
Estimate the value of \( r \) when \( \theta = 2 \).
▶️ Answer/Explanation
Compute the endpoint values:
\( f(1) = 4 \)
\( f(3) = 2 \)
Average rate of change:
\( \dfrac{2 – 4}{3 – 1} = -1 \)
Estimate at \( \theta = 2 \):
\( f(2) \approx 4 + (-1)(2 – 1) = 3 \)
Conclusion: The estimated radius is 3.