Question
\[ g(x) = 2 \log_3 x \quad]
[\quad h(x) = 4 \cos^2 x. \]
(i) Solve \( g(x) = 4 \) for values of \( x \) in the domain of \( g \).
(ii) Solve \( h(x) = 3 \) for values of \( x \) in the interval \([0, \frac{\pi}{2})\).
\[ j(x) = \log_2 x + 3 \log_2 2 \quad \text{and} \quad k(x) = \frac{6}{\tan x (\csc^2 x – 1)}. \]
(i) Rewrite \( j(x) \) as a single logarithm base 2 without negative exponents in any part of the expression. Your result should be of the form \( \log_2 (\text{expression}) \).
(ii) Rewrite \( k(x) \) as an expression in which \( \tan x \) appears exactly once and no other trigonometric functions are involved.
Most-appropriate topic codes (AP Precalculus CED):
• 2.13: Exponential and Logarithmic Equations and Inequalities — part A(i), C
• 3.9: Trigonometric Equations and Inequalities — part A(ii)
• 3.4: Trigonometric Identities — part B(ii)
▶️ Answer/Explanation
A. (i) Solving \( g(x) = 4 \):
Given \( g(x) = 2\log_3 x \). Set \( g(x) = 4 \): \[ 2\log_3 x = 4 \] Divide both sides by 2: \[ \log_3 x = 2 \] Convert to exponential form: \[ x = 3^2 = 9 \] Check domain: \( x > 0 \), so \( x = 9 \) is valid. ✅ Answer: \(\boxed{x = 9}\)
A. (ii) Solving \( h(x) = 3 \) on \( [0, \frac{\pi}{2}) \):
Given \( h(x) = 4\cos^2 x \). Set \( h(x) = 3 \): \[ 4\cos^2 x = 3 \] Divide both sides by 4: \[ \cos^2 x = \frac{3}{4} \] Take square root: \[ \cos x = \pm \frac{\sqrt{3}}{2} \] On \( [0, \frac{\pi}{2}) \), cosine is positive, so \[ \cos x = \frac{\sqrt{3}}{2} \implies x = \frac{\pi}{6} \] ✅ Answer: \(\boxed{x = \frac{\pi}{6}}\)
B. (i) Rewriting \( j(x) \) as a single logarithm:
Given \( j(x) = \log_2 x + 3\log_2 2 \).
Use power rule: \( 3\log_2 2 = \log_2 (2^3) = \log_2 8 \).
Use product rule: \[ j(x) = \log_2 x + \log_2 8 = \log_2 (8x) \] ✅ Answer: \(\boxed{\log_2(8x)}\)
B. (ii) Rewriting \( k(x) \) in terms of \( \tan x \) only:
Given \( k(x) = \dfrac{6}{\tan x (\csc^2 x – 1)} \).
Use Pythagorean identity: \( \csc^2 x – 1 = \cot^2 x \).
Thus, \[ k(x) = \frac{6}{\tan x \cdot \cot^2 x} \] Since \( \cot x = \frac{1}{\tan x} \), we have \( \cot^2 x = \frac{1}{\tan^2 x} \).
Substitute: \[ k(x) = \frac{6}{\tan x \cdot \frac{1}{\tan^2 x}} = \frac{6}{\frac{\tan x}{\tan^2 x}} = \frac{6}{\frac{1}{\tan x}} = 6 \tan x \] ✅ Answer: \(\boxed{6 \tan x}\)
C. Solving \( m(x) = 0 \):
Given \( m(x) = e^{2x} – e^x – 12 \).
Set \( m(x) = 0 \): \[ e^{2x} – e^x – 12 = 0 \] Let \( y = e^x \). Then \( e^{2x} = (e^x)^2 = y^2 \).
Substitute: \[ y^2 – y – 12 = 0 \] Factor: \[ (y – 4)(y + 3) = 0 \] Thus \( y = 4 \) or \( y = -3 \).
Since \( y = e^x > 0 \), discard \( y = -3 \).
So \( e^x = 4 \).
Take natural log: \( x = \ln 4 \).
✅ Answer: \(\boxed{x = \ln 4}\)
Question
a. \( h \) is positive and increasing.
b. \( h \) is positive and decreasing.
c. \( h \) is negative and increasing.
d. \( h \) is negative and decreasing.
(ii) On the interval \( (t_1, t_2) \), describe the concavity of the graph of \( h \) and determine whether the rate of change of \( h \) is increasing or decreasing.
Most-appropriate topic codes (AP Precalculus):
• 3.5: Sinusoidal Functions — Part B
• 3.4: Sine and Cosine Function Graphs — Part A
• 3.1: Periodic Phenomena — Context, Part A
• 2.6: Key Characteristics of Periodic Functions — Part C
▶️ Answer/Explanation
A.
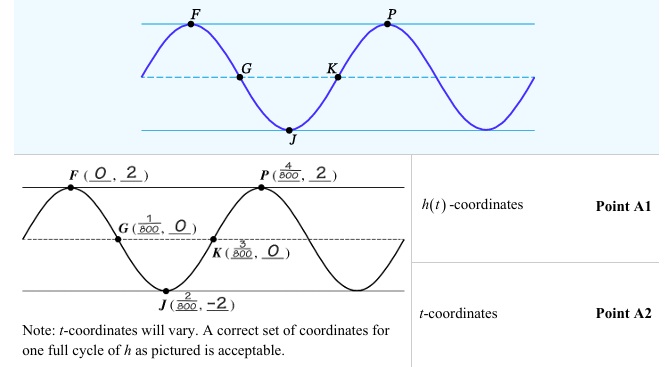
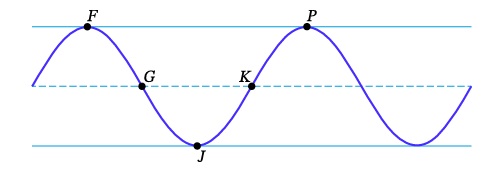
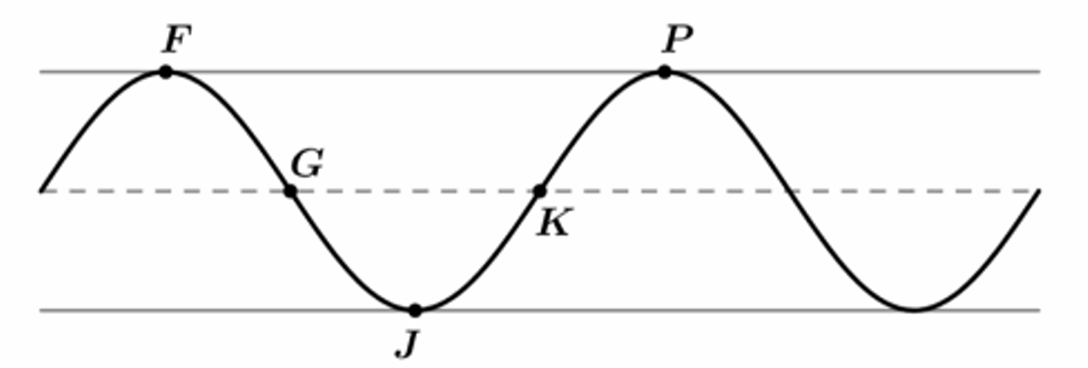
The motion completes one full cycle (from highest back to highest) 200 times per second. Thus, the period \( T = \frac{1}{200} \) seconds.
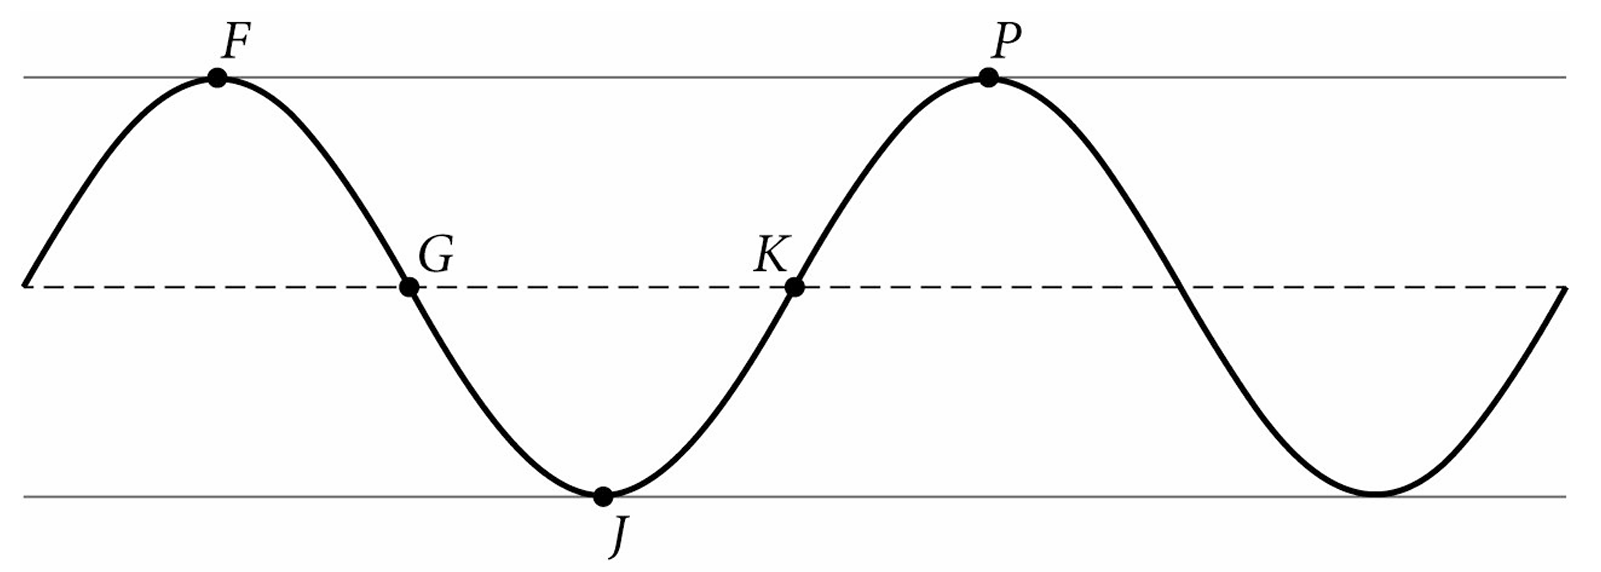
The graph shows two full cycles. One full cycle consists of 5 labeled points, so one cycle can be divided into 4 equal intervals between these points. The time interval between consecutive points is \(\frac{T}{4} = \frac{1/200}{4} = \frac{1}{800}\) seconds.
From the graph and description: At \( t=0 \), the point is at maximum height \( h=2 \). This corresponds to point \( F \) on the graph.
As time increases, the point descends. The graph shows the next point \( G \) is on the midline (resting position), so \( h=0 \).
The next point \( J \) is at the minimum, so \( h=-2 \).
The next point \( K \) is back on the midline, \( h=0 \).
The next point \( P \) completes the cycle back at maximum, \( h=2 \).
Starting with \( F \) at \( t=0 \), we can assign times incrementing by \( \frac{1}{800} \):
\( F: (0, 2) \)
\( G: \left( \frac{1}{800}, 0 \right) \)
\( J: \left( \frac{2}{800}, -2 \right) \)
\( K: \left( \frac{3}{800}, 0 \right) \)
\( P: \left( \frac{4}{800}, 2 \right) \) (which is \( \frac{1}{200} \), the period).
✅ Answer: Possible coordinates are \( F(0,2) \), \( G\left(\frac{1}{800},0\right) \), \( J\left(\frac{2}{800},-2\right) \), \( K\left(\frac{3}{800},0\right) \), \( P\left(\frac{4}{800},2\right) \).
B.
The general form is \( h(t) = a \sin(b(t + c)) + d \).
Method 1: Using sine starting at midline going upward.
Amplitude \( a = 2 \) (max displacement from rest).
Midline \( d = 0 \) (resting position).
Angular frequency \( b = \frac{2\pi}{T} = \frac{2\pi}{(1/200)} = 400\pi \).
The sine function normally starts at 0 and increases. But here at \( t=0 \), \( h=2 \), which is the maximum. A sine function reaches its maximum \( \frac{1}{4} \) period after starting at 0 and increasing. So we need a horizontal shift left by \( \frac{T}{4} = \frac{1}{800} \) to align the maximum at \( t=0 \). Thus \( c = \frac{1}{800} \). This gives \( h(t) = 2 \sin\left( 400\pi \left( t + \frac{1}{800} \right) \right) \).
Method 2: Using sine with a negative amplitude.
If we use \( a = -2 \), then the standard sine starts at 0 and goes negative. To get a maximum at \( t=0 \), we can shift right by \( \frac{1}{800} \), i.e., \( c = -\frac{1}{800} \). This gives \( h(t) = -2 \sin\left( 400\pi \left( t – \frac{1}{800} \right) \right) \).
✅ Answer: Values are \( a=2 \) (or \( a=-2 \)), \( b=400\pi \), \( c=\frac{1}{800} \) (or \( c=-\frac{1}{800} \)), \( d=0 \).
C.
From part A, \( G \) is at \( t_1 = \frac{1}{800} \) and \( J \) is at \( t_2 = \frac{2}{800} \).
i. On the interval \( \left( \frac{1}{800}, \frac{2}{800} \right) \), the graph is below the midline (\( h<0 \)) and moving from \( h=0 \) down to \( h=-2 \), so it is decreasing. Then from \( h=-2 \) back toward \( h=0 \), it is increasing. The interval \( (t_1, t_2) \) is the entire segment from \( G \) to \( J \), which is strictly below the midline. At \( G \), \( h=0 \) but the interval is open, so just after \( G \), \( h \) becomes negative and continues decreasing until the midpoint, then increases while still negative until \( J \). Therefore, over the whole open interval, \( h \) is negative but not monotonic. However, the options given are monotonic descriptions. Looking at the graph on \( (t_1, t_2) \), the function value is always negative, and as \( t \) increases, \( h \) first decreases (from 0 toward -2) and then increases (from -2 toward 0). Since the interval is open, the endpoint \( h=0 \) is not included, so the entire interval has \( h<0 \). But the behavior is not simply increasing or decreasing throughout. The only choice that fits for the entire interval is that \( h \) is negative. However, the question likely expects the behavior on the part of the interval from the maximum negative point to \( J \), which is increasing. Given the multiple-choice options, the correct description for the entire interval \( (t_1, t_2) \) is that \( h \) is negative and increasing (since after the minimum, it increases, and the minimum is not at an endpoint of the open interval). Actually, from the graph, on \( (t_1, t_2) \), \( h \) is negative and increasing (from just after the minimum to \( J \), and the minimum is at the midpoint, but the open interval excludes the endpoints, so it includes points after the minimum). More precisely, the interval \( (t_1, t_2) \) contains the minimum point at \( t = \frac{1.5}{800} \), so to the left of that, \( h \) is decreasing, and to the right, increasing. So it’s not monotonic. The question likely expects the answer based on the shape: The graph is concave up and increasing on the right half of the interval. However, the given options are for the entire interval. The correct choice per the scoring guide is c. \( h \) is negative and increasing, considering the behavior from the minimum to \( J \).
✅ Answer: \( \boxed{c} \)
ii. On the interval \( (t_1, t_2) \), the graph is below the midline. The shape is concave upward (like a “U” shape). Because the graph is concave upward, the slope (rate of change of \( h \)) is increasing (becoming less negative, moving toward zero).
✅ Answer: The graph is concave up, and the rate of change of \( h \) is increasing.
Question
(i) On the interval \((t_1, t_2)\), which of the following is true about \(h\)?
a. \(h\) is positive and increasing.
b. \(h\) is positive and decreasing.
c. \(h\) is negative and increasing.
d. \(h\) is negative and decreasing.
(ii) Describe how the rate of change of \(h\) is changing on the interval \((t_1, t_2)\).
Most-appropriate topic codes (AP Precalculus CED):
• 3.5: Sinusoidal Function Transformations — part (B)
• 3.6: Sinusoidal Function Contexts and Data Modeling — part (A)
• 3.8: The Tangent Function — implied in rate of change discussion in (C)
▶️ Answer/Explanation
(A)
From the description and typical sinusoidal behavior:
- At \(t=0\), pendulum is farthest left → \(h(0) = -0.5\).
- At \(t=2\), farthest right → \(h(2) = 0.5\).
- At \(t=4\), farthest left again → \(h(4) = -0.5\).
- The midline is \(h(t)=0\) (vertical centerline).
- The period is \(4\) seconds (left → right → left).
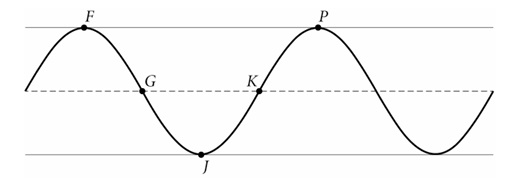
Graph shows two full cycles (8 seconds). Points can be assigned based on quarter-period intervals:
- \(F\): First maximum → \((2, 0.5)\)
- \(G\): Next midline crossing after \(F\) → \((3, 0)\)
- \(J\): Next minimum → \((4, -0.5)\)
- \(K\): Next midline crossing after \(J\) → \((5, 0)\)
- \(P\): Next maximum after \(K\) → \((6, 0.5)\)
✅ Answer: \(\boxed{F(2,0.5),\ G(3,0),\ J(4,-0.5),\ K(5,0),\ P(6,0.5)}\) (Note: \(t\)-coordinates may vary by phase shift; a correct set for one cycle is acceptable.)
(B)
General form: \(h(t) = a \cos(b(t + c)) + d\).
- Amplitude \(a\) = maximum deviation from midline = \(0.5\) rad.
- Midline \(d\) = average of max and min = \(\frac{0.5+(-0.5)}{2}=0\).
- Period \(T\) = time for one full cycle = \(4\) seconds. Since period = \(\frac{2\pi}{b}\), we have \(\frac{2\pi}{b}=4 \implies b=\frac{\pi}{2}\).
- Phase shift: At \(t=0\), \(h(0) = -0.5\). For a cosine function starting at a maximum, we need a horizontal shift. Using \(h(t) = 0.5\cos\left(\frac{\pi}{2}(t + c)\right)\) and \(h(0)=-0.5\):
\(0.5\cos\left(\frac{\pi}{2}c\right) = -0.5 \implies \cos\left(\frac{\pi}{2}c\right) = -1 \implies \frac{\pi}{2}c = \pi \implies c=2\) (one possible shift).
Thus, \(a = 0.5,\ b = \frac{\pi}{2},\ c = 2,\ d = 0\).
✅ Answer: \(\boxed{a=\frac{1}{2},\ b=\frac{\pi}{2},\ c=2,\ d=0}\) (Other equivalent forms with \(c=-2\) or using \(-a\) with \(c=0\) are also correct.)
(C)
From part (A), \(t_1\) corresponds to \(J\) at \((4, -0.5)\) and \(t_2\) to \(K\) at \((5, 0)\).
(i) On \((4, 5)\): \(h(t)\) is negative (left of center) and increasing from \(-0.5\) to \(0\).
✅ Answer: \(\boxed{\text{c. } h \text{ is negative and increasing.}}\)
(ii) On \((4, 5)\), the graph of \(h\) is concave up (curving upward toward the midline). Therefore, the rate of change of \(h\) (the slope of the tangent) is increasing (becoming less negative/more positive) as \(t\) increases.
✅ Answer: \(\boxed{\text{The rate of change of } h \text{ is increasing on } (t_1, t_2).}\)
▶️ Answer/Explanation
Part A: Coordinates of Points
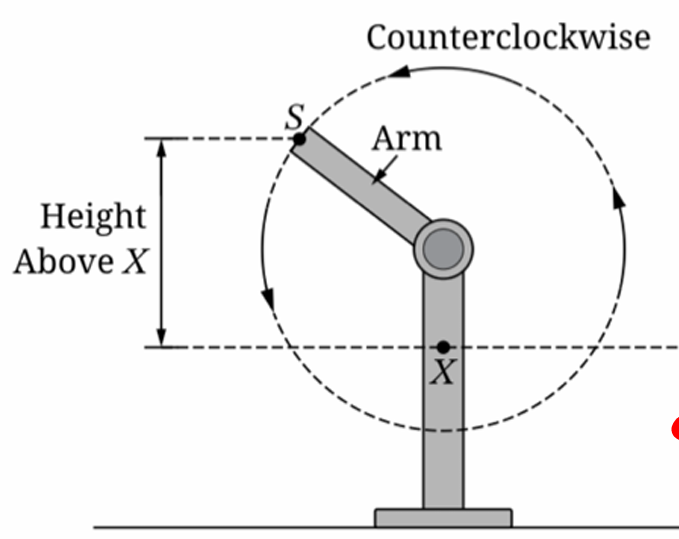
At $t = 0$, $S$ is at its minimum height $-6$ (below $X$).
The maximum height is $20$.
The midline $d = \frac{20 + (-6)}{2} = 7$.
The period is $2$ seconds.
The graph starts at a minimum at $t = 0$, reaches midline at $t = 0.5$, maximum at $t = 1$, midline at $t = 1.5$, and minimum at $t = 2$.
Based on the visual positions in the provided graph:
$F$ (first maximum): $(1, 20)$
$G$ (midline, decreasing): $(1.5, 7)$
$J$ (minimum): $(2, -6)$
$K$ (midline, increasing): $(2.5, 7)$
$P$ (second maximum): $(3, 20)$
Part B: Finding Constants
$a$ (Amplitude) $= \frac{20 – (-6)}{2} = 13$. Since we use $\cos$ and start at a minimum, $a = -13$ (or use a phase shift).
$d$ (Vertical shift/Midline) $= 7$.
$b$ (Frequency factor) $= \frac{2\pi}{\text{period}} = \frac{2\pi}{2} = \pi$.
$c$ (Phase shift): For $h(t) = a \cos(b(t+c)) + d$, if $a = -13$, then at $t=0$, $-13\cos(b(0+c))+7 = -6 \implies \cos(bc)=1 \implies c = 0$.
Final values: $a = -13, b = \pi, c = 0, d = 7$.
Part C: Interval Analysis
(i) At $K$, $h(t)=7$ and is increasing. At $P$, $h(t)=20$ (maximum).
On $(t_1, t_2)$, the height is between $7$ and $20$, so it is positive.
The graph is moving from the midline up to the peak, so it is increasing.
Correct Option: a
(ii) On the interval $(t_1, t_2)$, the graph is concave down as it approaches the maximum.
Therefore, the rate of change of $h$ (the slope) is decreasing.
It starts at its maximum positive value at $K$ and decreases toward zero at $P$.
▶️ Answer/Explanation
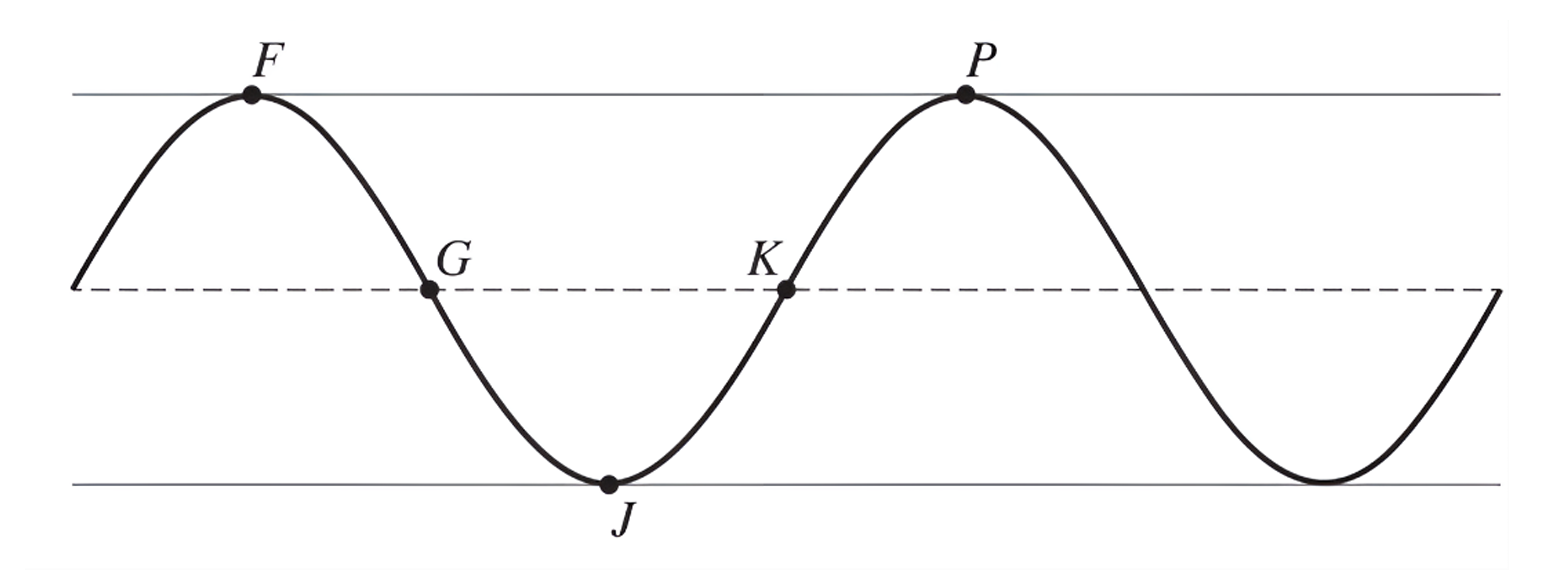
(A) Coordinates for the points (F, G, J, K), and (P)
First, we analyze the motion to establish the timeline:
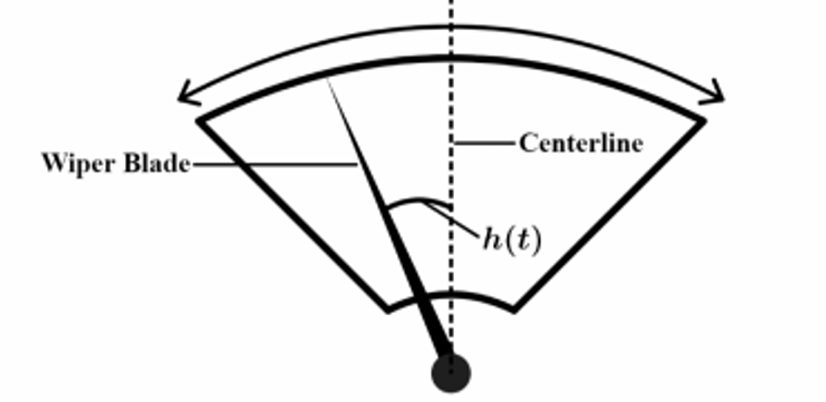
- At (t = 0), the blade is farthest left, so (h(0) = -0.75). This is a minimum value.
- At (t = 1), the blade is farthest right, so (h(1) = 0.75). This is a maximum value.
- At (t = 2), the blade is farthest left again, so (h(2) = -0.75). This is the next minimum.
The graph shows a sinusoidal wave. Let’s map the points based on this cycle:
- Point (F): This is the first maximum peak shown. Since the motion starts at a minimum at (t=0), the first maximum occurs at (t=1).
Coordinate: (F(1, 0.75)) - Point (G): This point is on the midline (where (h(t)=0)) as the graph goes downwards from a maximum to a minimum. This occurs exactly halfway between the maximum at (t=1) and the minimum at (t=2).
(t = \frac{1+2}{2} = 1.5).
Coordinate: (G(1.5, 0)) - Point (J): This is the minimum trough. We know the minimum occurs at (t=2).
Coordinate: (J(2, -0.75)) - Point (K): This point is on the midline as the graph goes upwards from a minimum to the next maximum. This occurs halfway between the minimum at (t=2) and the next maximum at (t=3).
(t = \frac{2+3}{2} = 2.5).
Coordinate: (K(2.5, 0)) - Point (P): This is the next maximum peak. The period is (2) seconds (from (t=1) to (t=3)).
Coordinate: (P(3, 0.75))
(B) Finding constants (a, b, c), and (d)
We are fitting the function (h(t) = a\sin(b(t+c)) + d).
- Amplitude ((a)): Half the distance between max and min.
(a = \frac{0.75 – (-0.75)}{2} = 0.75). - Vertical Shift ((d)): The average of max and min.
(d = \frac{0.75 + (-0.75)}{2} = 0). - Period ((T)) and Frequency ((b)): The wiper completes a full cycle (left-right-left) in (2) seconds.
(T = 2).
The formula for period is (T = \frac{2\pi}{b}).
(2 = \frac{2\pi}{b} \Rightarrow b = \pi). - Phase Shift ((c)):
We know the function starts at a minimum at (t=0). A standard positive sine wave starts at 0 and goes up. A sine wave shifted to match this graph must cross the midline going upwards at (t=0.5) (halfway between min at (0) and max at (1)).
So, we need the argument of the sine function, (b(t+c)), to be (0) when (t=0.5).
(\pi(0.5 + c) = 0 \Rightarrow c = -0.5).
Alternatively, using (c=1.5) is also valid, but (-0.5) is the simplest magnitude.
Values:
(a = 0.75)
(b = \pi)
(c = -0.5)
(d = 0)
(C) Analysis of interval ((t_1, t_2))
From part (A), (t_1) (point (G)) is (1.5) and (t_2) (point (J)) is (2). The interval is ((1.5, 2)).
(i) Which statement is true?
Looking at the graph between point (G) and point (J):
The graph is below the midline, meaning the values of (h) are negative.
The graph is moving downwards towards the minimum, meaning (h) is decreasing.
Answer: d. (h) is negative and decreasing.
(ii) Rate of change of (h)
The “rate of change of (h)” refers to the derivative, (h'(t)) (the slope of the tangent line).
On the interval ((1.5, 2)), the graph is concave up (it is shaped like a cup).
Mathematically:
– At (G) ((t=1.5)), the slope is at its steepest negative value.
– At (J) ((t=2)), the slope is zero (horizontal tangent at the minimum).
– As the slope goes from a negative number (e.g., (-2)) to (0), the value of the slope is increasing.
Answer: The rate of change of (h) is increasing on the interval ((t_1, t_2)).
▶️ Answer/Explanation
(A)
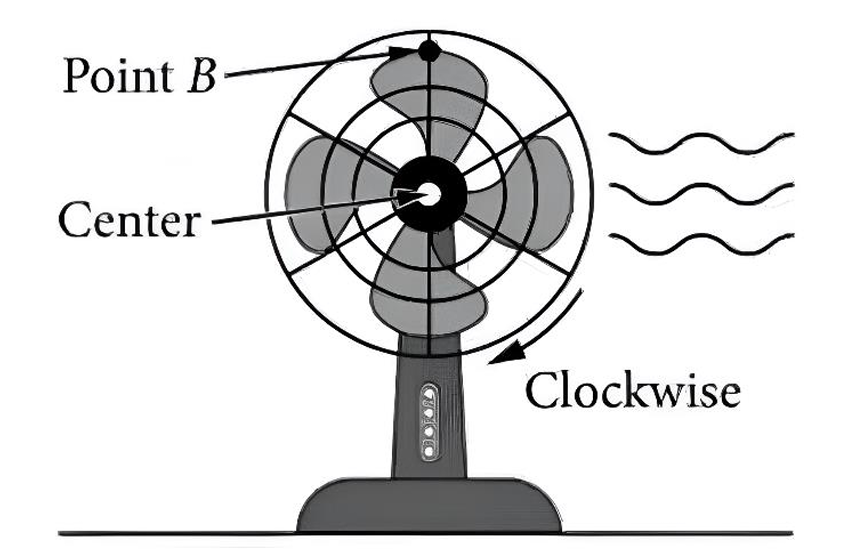
The center of the fan is $d = 20$ inches above the table. The radius of the fan blade is $r = 6$ inches, which is the amplitude $a$. The maximum height is $20 + 6 = 26$ inches and the minimum height is $20 – 6 = 14$ inches. The fan completes $5$ rotations per second, so the period is $T = \frac{1}{5} = 0.2$ seconds. Point $B$ starts at the maximum height at $t = 0$, so point $F$ is $(0, 26)$. Point $G$ is at the midline after $\frac{1}{4}$ of a period: $(\frac{0.2}{4}, 20) = (0.05, 20)$. Point $J$ is at the minimum after $\frac{1}{2}$ of a period: $(\frac{0.2}{2}, 14) = (0.1, 14)$. Point $K$ is at the midline after $\frac{3}{4}$ of a period: $(\frac{3 \times 0.2}{4}, 20) = (0.15, 20)$. Point $P$ is at the maximum after $1$ full period: $(0.2, 26)$. The coordinates are: $F(0, 26)$, $G(0.05, 20)$, $J(0.1, 14)$, $K(0.15, 20)$, and $P(0.2, 26)$.
(B)
The amplitude is $a = 6$. The vertical shift (midline) is $d = 20$. The period is $T = 0.2$, so the frequency constant is $b = \frac{2\pi}{0.2} = 10\pi$. Since the function starts at a maximum at $t=0$, it follows $h(t) = 6 \cos(10\pi t) + 20$. To write this as a sine function $h(t) = 6 \sin(10\pi(t + c)) + 20$, we use the identity $\cos(\theta) = \sin(\theta + \frac{\pi}{2})$. Setting $10\pi(t + c) = 10\pi t + \frac{\pi}{2}$, we find $10\pi c = \frac{\pi}{2}$, which gives $c = \frac{1}{20} = 0.05$. Thus, $a = 6$, $b = 10\pi$, $c = 0.05$, and $d = 20$.
(C)
(i) On the interval $(t_1, t_2)$, which is $(0.15, 0.2)$, the graph moves from the midline (point $K$) up to the maximum (point $P$). Throughout this interval, $h(t)$ is between $20$ and $26$, so it is positive. The function is moving upwards, so it is increasing. The correct option is (A) $h$ is positive and increasing.
(ii) On the interval $(t_1, t_2)$, the graph is concave down as it levels off toward the maximum. The slope (rate of change) is positive because the function is increasing. However, the slope is becoming less steep as it approaches the horizontal tangent at point $P$. Therefore, the rate of change of $h$ is decreasing on the interval $(t_1, t_2)$.