▶️ Answer/Explanation
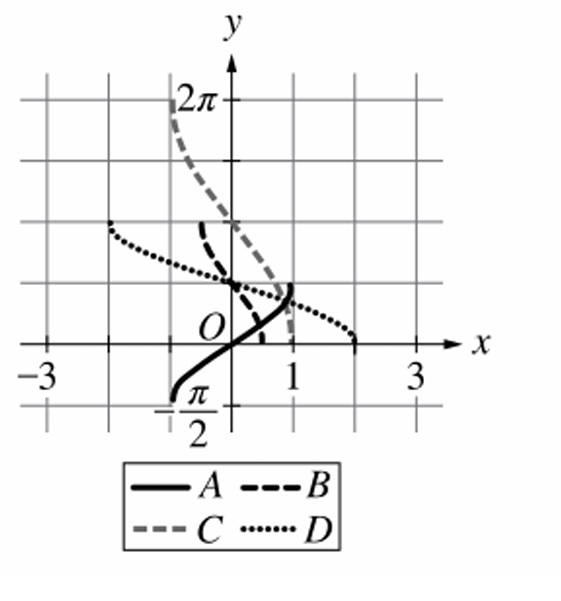
The function \( f(x) = 2\cos^{-1}x \) is a vertical stretch of \( y = \cos^{-1}x \) by factor 2.
– Domain: \( [-1, 1] \)
– Range: \( [0, 2\pi] \) after stretch (since \( \cos^{-1}x \) ranges from \( 0 \) to \( \pi \), multiplying by 2 gives \( 0 \) to \( 2\pi \))
Graph \( C \) matches this vertical dilation.
✅ Answer: (C)
▶️ Answer/Explanation
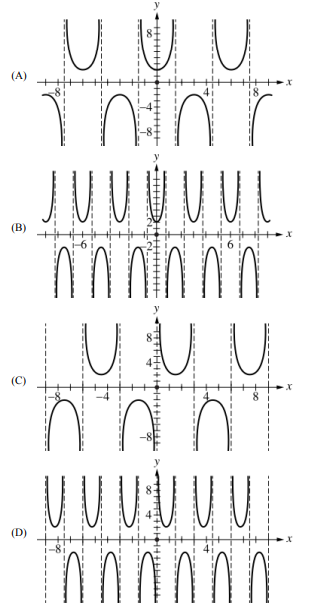
\( f(x) = 2\csc\left(\frac{2\pi}{3}x\right) \)
– Cosecant is reciprocal of sine: \( \csc u = \frac{1}{\sin u} \)
– Vertical asymptotes where \( \sin\left(\frac{2\pi}{3}x\right) = 0 \) → \( \frac{2\pi}{3}x = k\pi \) → \( x = \frac{3k}{2} = 1.5k \)
– Period: \( \frac{2\pi}{2\pi/3} = 3 \)
– Amplitude factor 2 outside → range: \( (-\infty, -2] \cup [2, \infty) \)
Graph (D) matches these features: asymptotes every 1.5 units, period 3, branches outside \( [-2, 2] \).
✅ Answer: (D)
▶️ Answer/Explanation
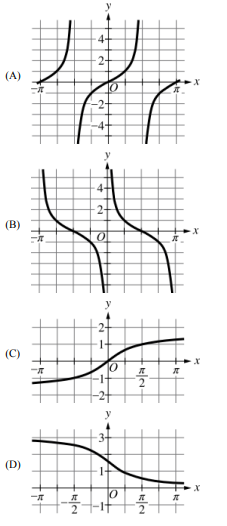
\( f(x) = \cot x = \frac{\cos x}{\sin x} \)
– Vertical asymptotes where \( \sin x = 0 \) → \( x = k\pi \)
– Decreasing on each interval \( (k\pi, (k+1)\pi) \)
– Passes through \( \left(\frac{\pi}{2} + k\pi, 0\right) \)
Graph (B) matches this behavior.
✅ Answer: (B)
▶️ Answer/Explanation
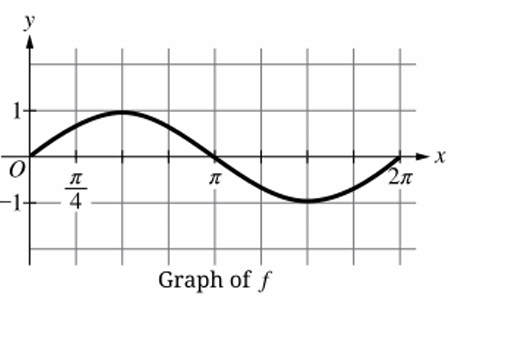
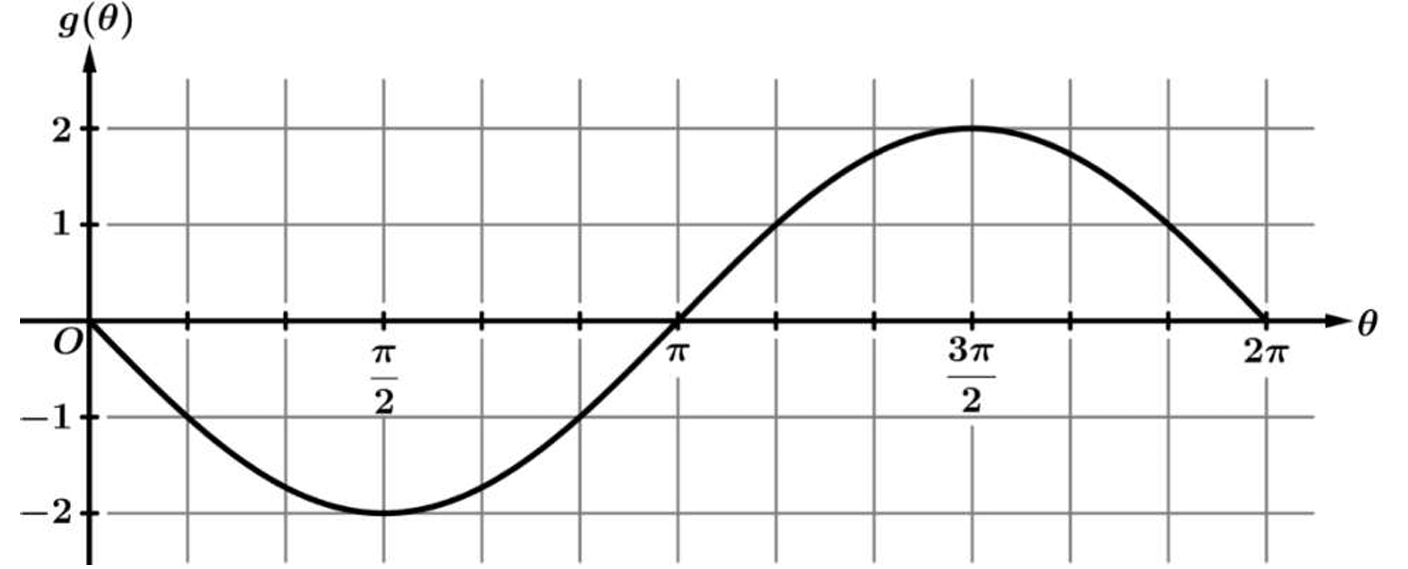
The graph begins at the origin, increases to a maximum at \( \frac{\pi}{2} \), returns to zero at \( \pi \), goes to a minimum at \( \frac{3\pi}{2} \), and returns to zero at \( 2\pi \). This is the graph of \( f(x) = \sin x \).
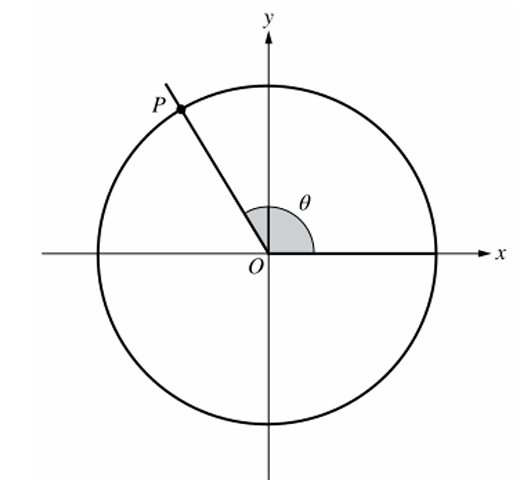
On the unit circle, for an angle \( \theta \), the sine function gives the \( y \)-coordinate of \( P \), which is the vertical displacement (signed distance) from the \( x \)-axis.
Thus \( f(\theta) = \sin\theta \) gives the vertical displacement of \( P \) from the \( x \)-axis.
✅ Answer: (C)
▶️ Answer/Explanation
The correct answer is (C).
1. Analyze the function value: Looking at the graph in the interval \( 0 < \theta < \frac{\pi}{2} \), the curve goes downwards from the origin to a minimum. Since the values of \( g(\theta) \) are dropping, \( g \) is decreasing.
2. Analyze the rate of change (slope): The graph is concave up (curved like a cup) in this interval. Mathematically, the slope starts as a steep negative value and approaches zero (becomes less negative).
3. Interpret the rate: Since the slope is moving from a negative value towards zero (e.g., from -2 to -0.5), the numerical value of the rate is increasing.
Conclusion: Therefore, the function is decreasing (values going down) at an increasing rate (slope is increasing).
▶️ Answer/Explanation
Step 1: Identify the interval on the horizontal axis from \( \theta = \frac{\pi}{2} \) to \( \theta = \pi \).
Step 2: Observe the position of the graph relative to the horizontal axis. In this region, the curve is strictly below the \( \theta \)-axis, which means \( g(\theta) \) is negative.
Step 3: Analyze the slope of the curve. Starting from \( \theta = \frac{\pi}{2} \), the graph is at its minimum value of \( -2 \) and moves upwards to \( 0 \) at \( \theta = \pi \).
Step 4: Since the \( y \)-values are getting larger (moving from negative towards zero), the function is increasing.
Step 5: Therefore, on the interval \( \frac{\pi}{2} < \theta < \pi \), \( g \) is negative and increasing.
Step 6: Comparing this with the given options, it corresponds to option (C).
▶️ Answer/Explanation
The correct answer is (D).
1. Analyze the Graph Shape: Observe the graph on the interval \( \pi < \theta < \frac{3\pi}{2} \). The curve is shaped like an inverted bowl, bending downwards.
2. Determine Concavity: This downward bending shape indicates that the graph is concave down on this interval.
3. Connect to Rate of Change: The “rate of change of \( g \)” is the first derivative, \( g’ \). Concavity is determined by the second derivative, \( g” \).
4. Interpret Concavity: If a function is concave down, its derivative (slope) is decreasing.
5. Visual Verification: At \( \theta = \pi \), the slope is positive and steep. As \( \theta \) approaches \( \frac{3\pi}{2} \), the tangent line flattens out (slope approaches 0). Thus, the slope is decreasing.
6. Conclusion: The rate of change is decreasing because the graph is concave down.
▶️ Answer/Explanation
The correct option is (D).
1. Identify the relevant section of the graph: The interval \(\frac{3\pi}{2} < \theta < 2\pi\) corresponds to the curve segment after the peak, descending towards the x-axis.
2. Determine the sign of the rate of change: In this interval, the function values \(g(\theta)\) are dropping from the maximum (2) down to 0.
3. Since the function is strictly decreasing, the slope of the tangent (rate of change) is negative.
4. Analyze the behavior of the rate of change: At the peak \(\theta = \frac{3\pi}{2}\), the slope is zero (horizontal tangent).
5. As \(\theta\) increases towards \(2\pi\), the graph becomes steeper in the downward direction.
6. This means the slope values are changing from 0 to negative numbers (e.g., -1, -2).
7. Since the value of the slope is going down (becoming more negative), the rate of change is decreasing.
8. Therefore, the rate of change of \(g\) is negative and decreasing.
▶️ Answer/Explanation
The correct answer is (B).
1. First, locate the interval \(\left( 0, \frac{\pi}{2} \right)\) on the horizontal axis (\(\theta\)-axis) of the provided graph.
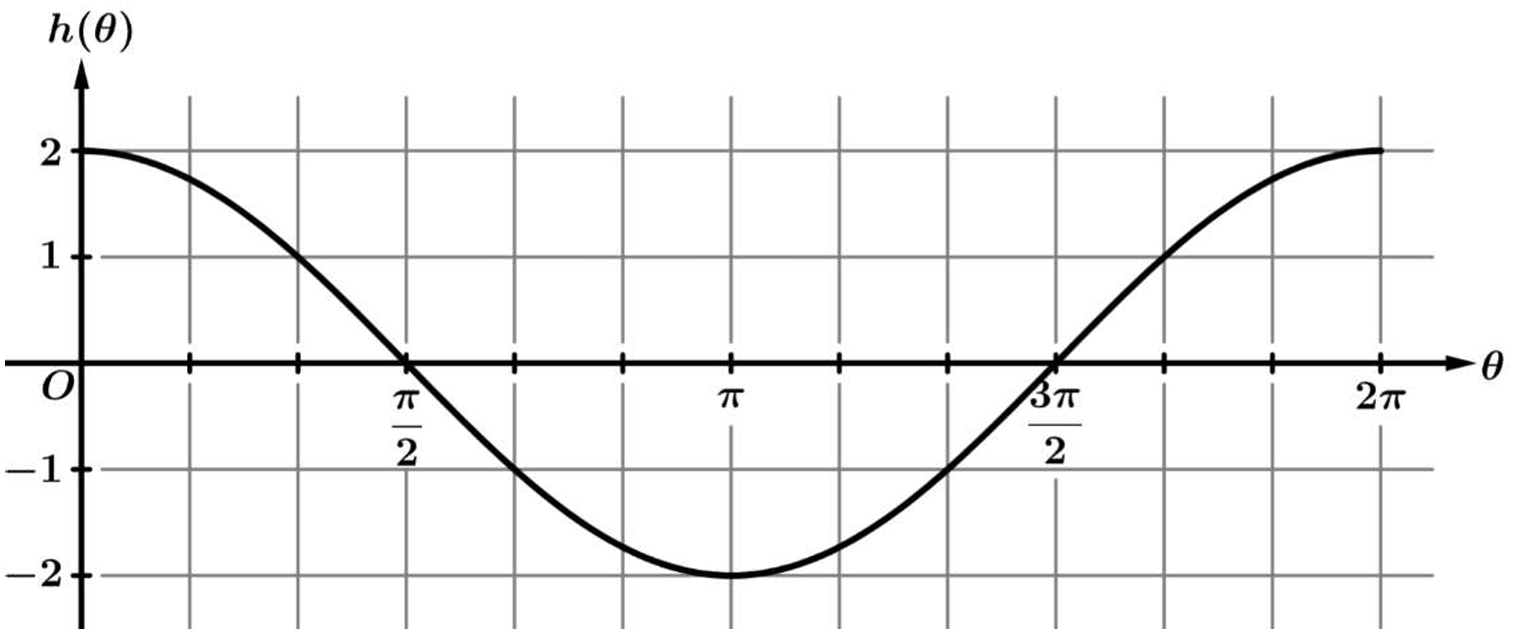
2. Observe the position of the function \(h(\theta)\) relative to the x-axis. In this specific interval, the graph is entirely above the x-axis, which means \(h\) is positive.
3. Next, observe the direction of the curve as you move from left to right (from \(0\) to \(\frac{\pi}{2}\)).
4. The value of \(h(\theta)\) starts at \(2\) and goes down to \(0\). A downward slope indicates that the function is decreasing.
5. Therefore, on the interval \(\left( 0, \frac{\pi}{2} \right)\), \(h\) is positive and decreasing.
▶️ Answer/Explanation
The correct answer is (D).
1. Identify the interval \(\left(\frac{\pi}{2}, \pi\right)\) on the horizontal \(\theta\)-axis.
2. Observe the position of the curve relative to the horizontal axis. The graph lies below the x-axis in this interval, meaning the function values \(h(\theta)\) are negative.
3. Analyze the slope of the curve as you move from left to right. The graph slopes downwards, going from a value of \(0\) at \(\frac{\pi}{2}\) to \(-2\) at \(\pi\).
4. Since the function values are falling, \(h\) is decreasing.
5. Therefore, on this interval, \(h\) is both negative and decreasing.
▶️ Answer/Explanation
▶️ Answer/Explanation
(A)
1. First, identify the relevant section of the graph on the horizontal axis between \(\theta = \frac{3\pi}{2}\) and \(\theta = 2\pi\).
2. Check the sign of the function: The curve lies entirely above the horizontal axis (the \(\theta\)-axis) in this interval, which means \(h(\theta) > 0\) (it is positive).
3. Check the direction of the function: As you move from left to right along the interval, the curve goes upwards, rising from \(0\) to \(2\).
4. Since the curve is going up, the slope is positive, meaning the function is increasing.
5. Therefore, \(h\) is positive and increasing.
▶️ Answer/Explanation
The “rate of change of \( h \)” refers to the slope of the function (the first derivative, \( h’ \)).
The change in this rate is determined by the concavity of the graph (the second derivative, \( h” \)).
On the interval \( \left(0, \frac{\pi}{2}\right) \), the graph of \( h \) curves downwards, resembling an upside-down bowl.
This shape indicates that the graph is concave down in this region.
When a graph is concave down, the slope of the tangent lines decreases as \( \theta \) increases.
Therefore, the rate of change of \( h \) is decreasing because the graph of \( h \) is concave down.
Correct Option: (D)
▶️ Answer/Explanation
The correct answer is (A).
1. Analyze the Graph Shape: Observe the curve of \(h(\theta)\) on the interval \(\left(\frac{\pi}{2}, \pi\right)\). The graph curves upwards, resembling the shape of a bowl “holding water.”
2. Determine Concavity: This upward curvature indicates that the function is concave up on this specific interval.
3. Relate Concavity to Rate of Change: By definition, if the graph of a function is concave up, its first derivative (which represents the rate of change) is increasing.
4. Verify with Slopes: At \(\theta = \frac{\pi}{2}\), the slope is steep and negative. As \(\theta\) approaches \(\pi\), the slope becomes less negative and reaches zero. Since the slope values are rising from a negative number to zero, the rate of change is increasing.
5. Conclusion: Therefore, the rate of change of \(h\) is increasing because the graph of \(h\) is concave up.
▶️ Answer/Explanation
The correct answer is (A).
1. First, identify the section of the graph on the interval \( \left( \pi, \frac{3\pi}{2} \right) \). In this region, the curve is bending upwards (holding water), which means the graph is concave up.
2. The “rate of change of \( h \)” refers to the first derivative, \( h'(\theta) \), or the slope of the tangent line.
3. “How the rate of change is changing” refers to the second derivative, \( h”(\theta) \).
4. When a graph is concave up, its second derivative is positive (\( h”(\theta) > 0 \)).
5. A positive second derivative implies that the first derivative (the rate of change) is increasing.
6. Visually, the slope of the graph starts at \( 0 \) at \( \theta = \pi \) and becomes steeper in the positive direction as it approaches \( \frac{3\pi}{2} \).
▶️ Answer/Explanation
The correct answer is (D).
The “rate of change of \( h \)” represents the slope of the graph’s tangent line.
The phrase “how the rate of change is changing” refers to the concavity of the graph (the second derivative).
On the interval \( \left( \frac{3\pi}{2}, 2\pi \right) \), the graph curves downwards, resembling an inverted bowl.
This geometric shape indicates that the graph is concave down on this interval.
Mathematically, when a graph is concave down, its slope (rate of change) is strictly decreasing.
Therefore, the rate of change of \( h \) is decreasing because the graph of \( h \) is concave down.
▶️ Answer/Explanation
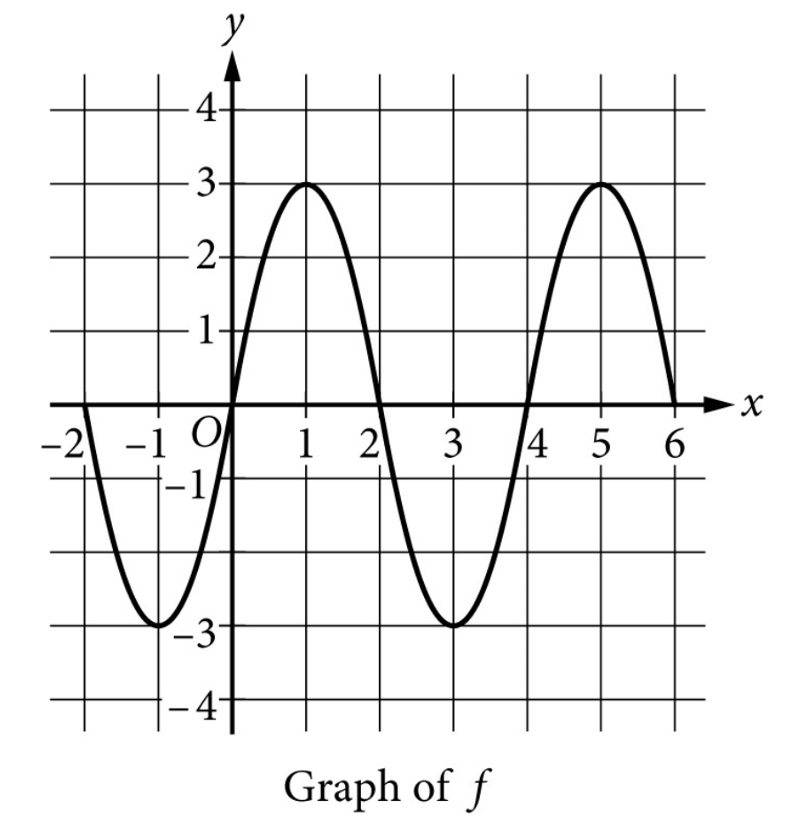
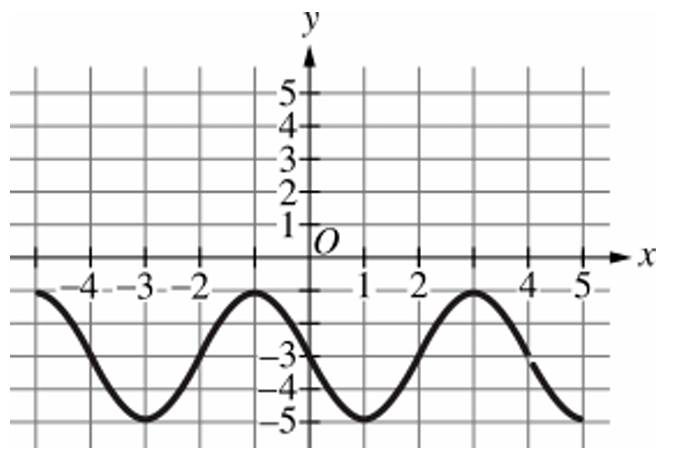
The period is the horizontal length of one complete cycle of the function’s graph.
We can find this by measuring the distance between two consecutive peaks (maximums).
Looking at the graph, the first peak is located at \( x = 1 \).
The next consecutive peak is located at \( x = 5 \).
The period is calculated as the difference between these x-values: \( 5 – 1 = 4 \).
Alternatively, a full cycle starting from the origin at \( x = 0 \) completes at \( x = 4 \).
Thus, the period of \( f \) is \( 4 \).
Correct Answer: (C)
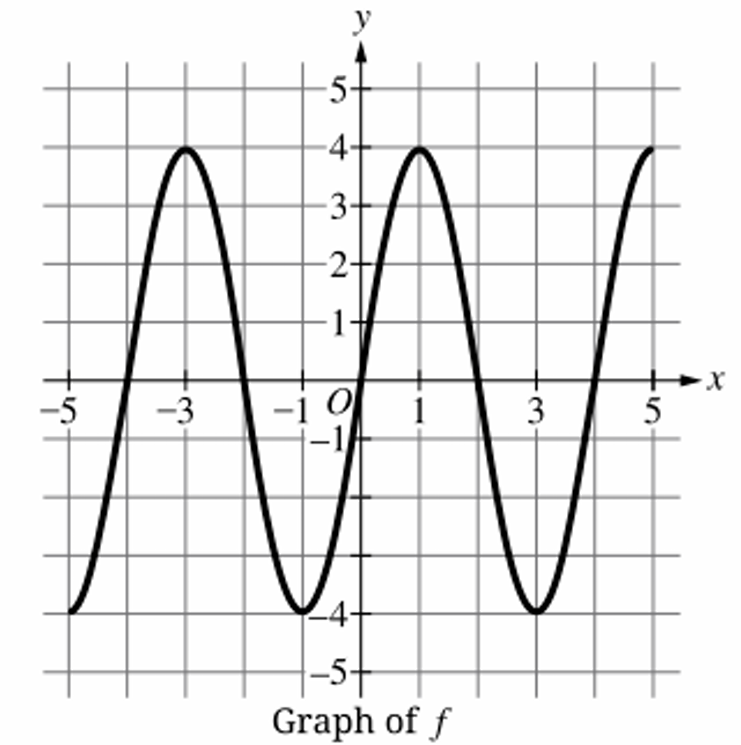
▶️ Answer/Explanation
The period of a periodic function is the horizontal distance required for the graph to complete one full cycle.
By observing the graph of $f$, a peak occurs at $x = 1$ and the next peak occurs at $x = 5$.
Therefore, the period of $f$ is calculated as $5 – 1 = 4$ units.
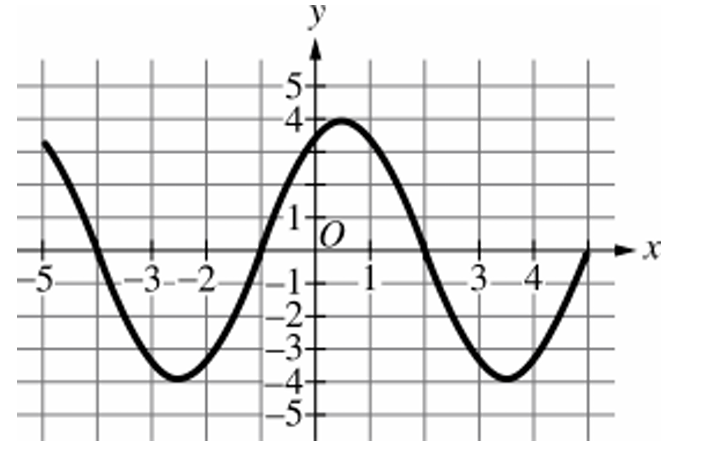
Looking at Option (A), a peak occurs at $x = 0$ and the next peak occurs at $x = 4$.
The period for Option (A) is $4 – 0 = 4$ units, which matches function $f$.
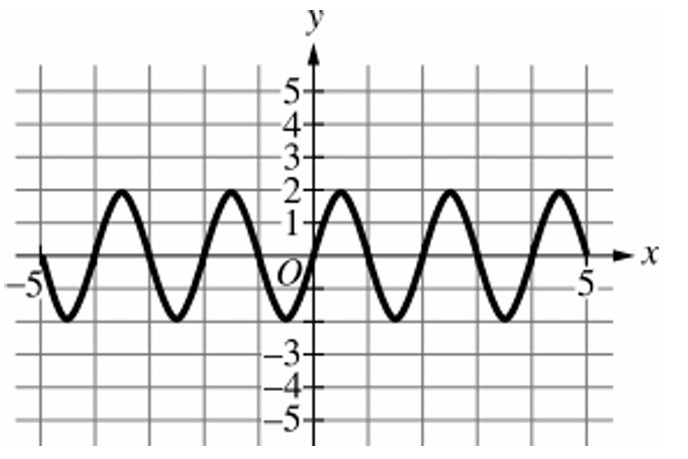
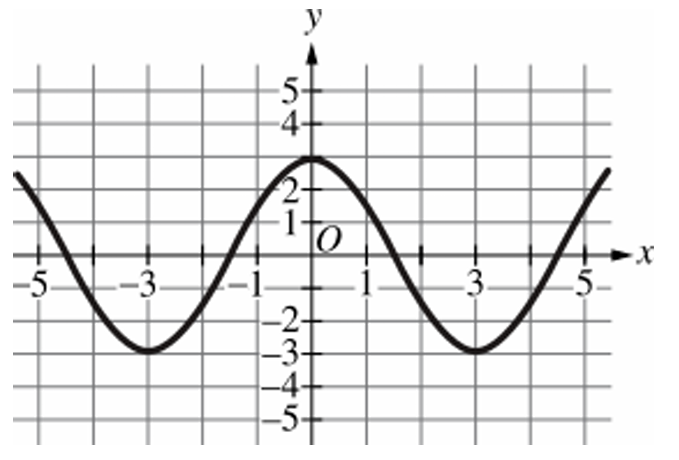
Other options have different periods: (B) has a period of $2$, (C) has a period of $8$, and (D) has a period of $6$.
Thus, the function in Option (A) has the same period as $f$.
▶️ Answer/Explanation
The function is defined as $g(z) = \cos z$.
The angle $\theta$ is in the second quadrant, where $\frac{\pi}{2} < \theta < \pi$.
We are given the interval $\theta < \omega < \pi$.
In the second quadrant, the cosine function is strictly decreasing.
As the angle $z$ increases from $\theta$ toward $\pi$, the $x$-coordinate on the unit circle moves left.
Therefore, if $\omega > \theta$, then $\cos \omega < \cos \theta$.
This means $g(\omega) < g(\theta)$, making (A) the correct choice.
▶️ Answer/Explanation
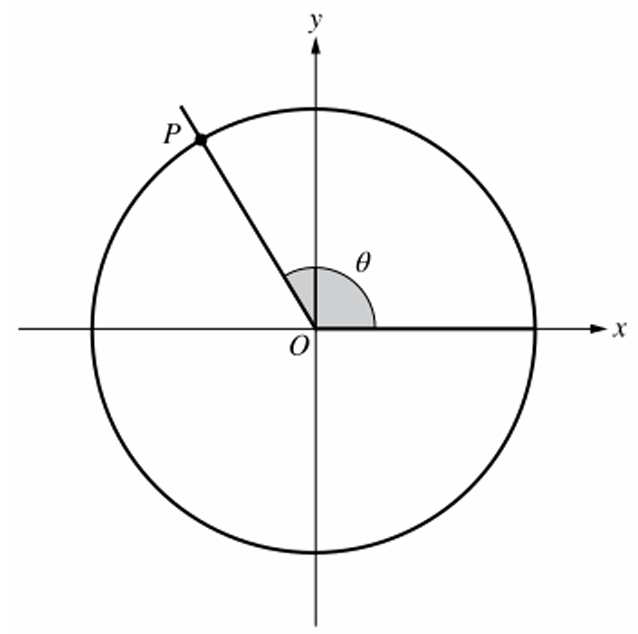
The point $P$ is in the second quadrant, meaning $\frac{\pi}{2} < \theta < \pi$.
The function is defined as $f(z) = \sin z$.
In the interval $(\frac{\pi}{2}, \pi)$, the sine function is strictly decreasing.
Given the inequality $\frac{\pi}{2} < \beta < \theta$, both angles are in the second quadrant.
Since $\beta < \theta$ and sine is decreasing here, it follows that $\sin \beta > \sin \theta$.
Therefore, $f(\beta) > f(\theta)$, which corresponds to option (B).