▶️ Answer/Explanation
Part A: Coordinates of Points
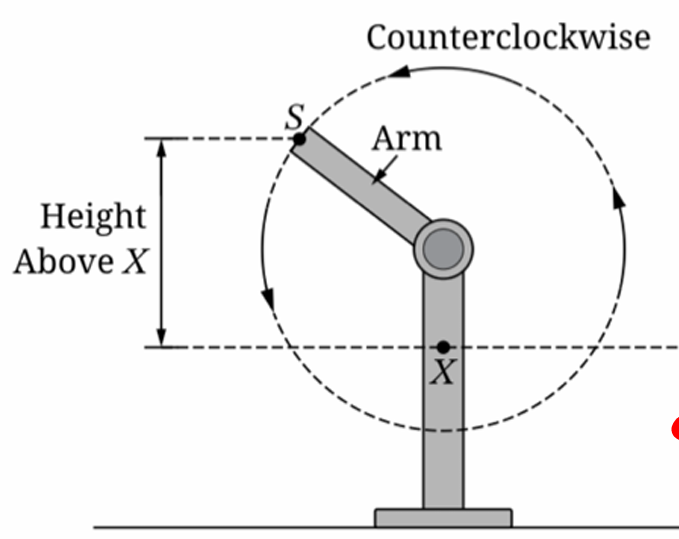
At $t = 0$, $S$ is at its minimum height $-6$ (below $X$).
The maximum height is $20$.
The midline $d = \frac{20 + (-6)}{2} = 7$.
The period is $2$ seconds.
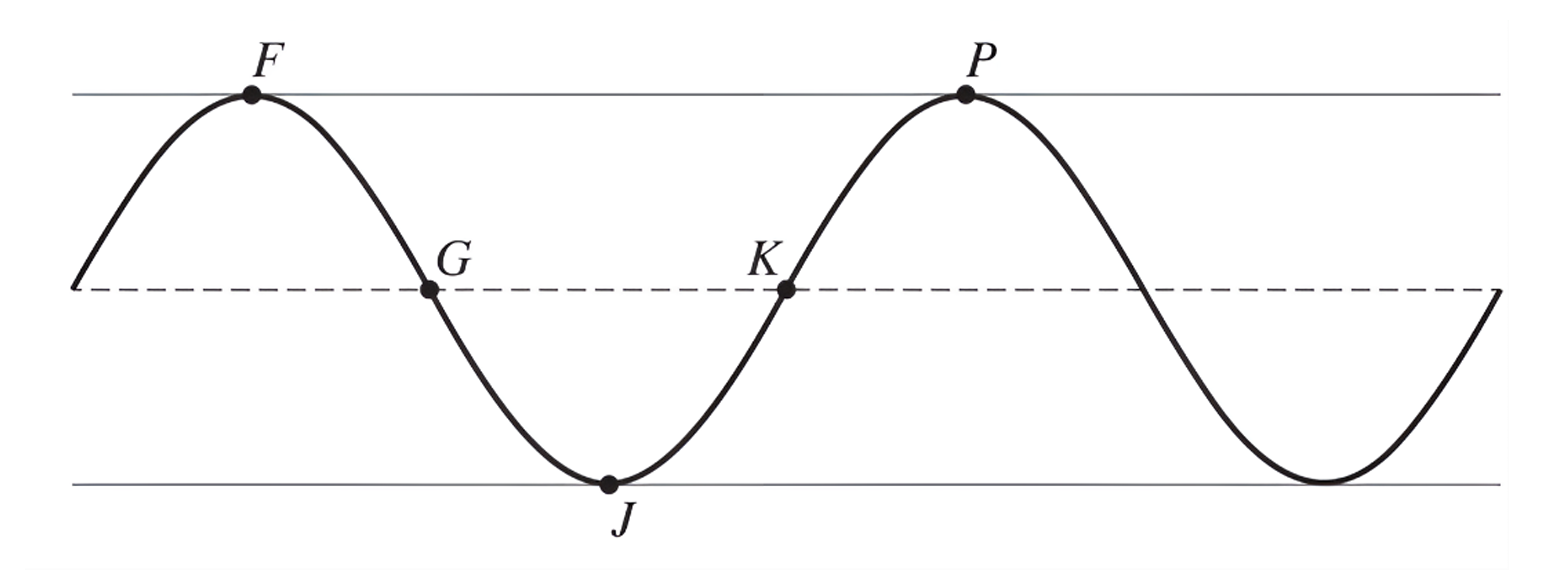
The graph starts at a minimum at $t = 0$, reaches midline at $t = 0.5$, maximum at $t = 1$, midline at $t = 1.5$, and minimum at $t = 2$.
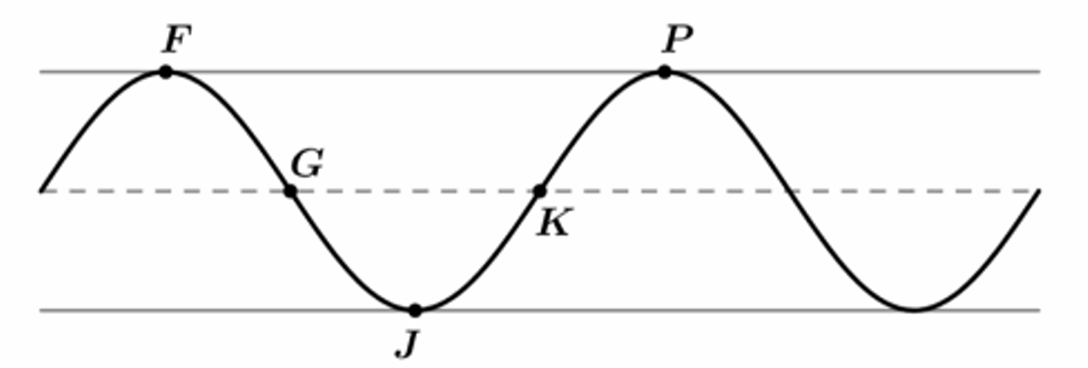
Based on the visual positions in the provided graph:
$F$ (first maximum): $(1, 20)$
$G$ (midline, decreasing): $(1.5, 7)$
$J$ (minimum): $(2, -6)$
$K$ (midline, increasing): $(2.5, 7)$
$P$ (second maximum): $(3, 20)$
Part B: Finding Constants
$a$ (Amplitude) $= \frac{20 – (-6)}{2} = 13$. Since we use $\cos$ and start at a minimum, $a = -13$ (or use a phase shift).
$d$ (Vertical shift/Midline) $= 7$.
$b$ (Frequency factor) $= \frac{2\pi}{\text{period}} = \frac{2\pi}{2} = \pi$.
$c$ (Phase shift): For $h(t) = a \cos(b(t+c)) + d$, if $a = -13$, then at $t=0$, $-13\cos(b(0+c))+7 = -6 \implies \cos(bc)=1 \implies c = 0$.
Final values: $a = -13, b = \pi, c = 0, d = 7$.
Part C: Interval Analysis
(i) At $K$, $h(t)=7$ and is increasing. At $P$, $h(t)=20$ (maximum).
On $(t_1, t_2)$, the height is between $7$ and $20$, so it is positive.
The graph is moving from the midline up to the peak, so it is increasing.
Correct Option: a
(ii) On the interval $(t_1, t_2)$, the graph is concave down as it approaches the maximum.
Therefore, the rate of change of $h$ (the slope) is decreasing.
It starts at its maximum positive value at $K$ and decreases toward zero at $P$.
▶️ Answer/Explanation
(A) Coordinates for the points (F, G, J, K), and (P)
First, we analyze the motion to establish the timeline:
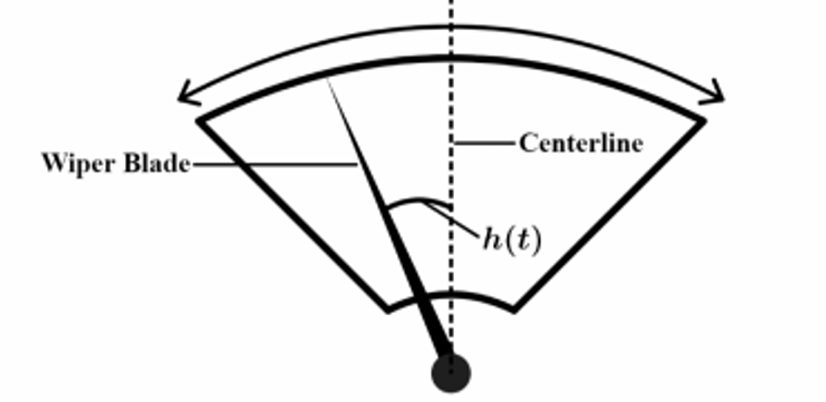
- At (t = 0), the blade is farthest left, so (h(0) = -0.75). This is a minimum value.
- At (t = 1), the blade is farthest right, so (h(1) = 0.75). This is a maximum value.
- At (t = 2), the blade is farthest left again, so (h(2) = -0.75). This is the next minimum.
The graph shows a sinusoidal wave. Let’s map the points based on this cycle:
- Point (F): This is the first maximum peak shown. Since the motion starts at a minimum at (t=0), the first maximum occurs at (t=1).
Coordinate: (F(1, 0.75)) - Point (G): This point is on the midline (where (h(t)=0)) as the graph goes downwards from a maximum to a minimum. This occurs exactly halfway between the maximum at (t=1) and the minimum at (t=2).
(t = \frac{1+2}{2} = 1.5).
Coordinate: (G(1.5, 0)) - Point (J): This is the minimum trough. We know the minimum occurs at (t=2).
Coordinate: (J(2, -0.75)) - Point (K): This point is on the midline as the graph goes upwards from a minimum to the next maximum. This occurs halfway between the minimum at (t=2) and the next maximum at (t=3).
(t = \frac{2+3}{2} = 2.5).
Coordinate: (K(2.5, 0)) - Point (P): This is the next maximum peak. The period is (2) seconds (from (t=1) to (t=3)).
Coordinate: (P(3, 0.75))
(B) Finding constants (a, b, c), and (d)
We are fitting the function (h(t) = a\sin(b(t+c)) + d).
- Amplitude ((a)): Half the distance between max and min.
(a = \frac{0.75 – (-0.75)}{2} = 0.75). - Vertical Shift ((d)): The average of max and min.
(d = \frac{0.75 + (-0.75)}{2} = 0). - Period ((T)) and Frequency ((b)): The wiper completes a full cycle (left-right-left) in (2) seconds.
(T = 2).
The formula for period is (T = \frac{2\pi}{b}).
(2 = \frac{2\pi}{b} \Rightarrow b = \pi). - Phase Shift ((c)):
We know the function starts at a minimum at (t=0). A standard positive sine wave starts at 0 and goes up. A sine wave shifted to match this graph must cross the midline going upwards at (t=0.5) (halfway between min at (0) and max at (1)).
So, we need the argument of the sine function, (b(t+c)), to be (0) when (t=0.5).
(\pi(0.5 + c) = 0 \Rightarrow c = -0.5).
Alternatively, using (c=1.5) is also valid, but (-0.5) is the simplest magnitude.
Values:
(a = 0.75)
(b = \pi)
(c = -0.5)
(d = 0)
(C) Analysis of interval ((t_1, t_2))
From part (A), (t_1) (point (G)) is (1.5) and (t_2) (point (J)) is (2). The interval is ((1.5, 2)).
(i) Which statement is true?
Looking at the graph between point (G) and point (J):
The graph is below the midline, meaning the values of (h) are negative.
The graph is moving downwards towards the minimum, meaning (h) is decreasing.
Answer: d. (h) is negative and decreasing.
(ii) Rate of change of (h)
The “rate of change of (h)” refers to the derivative, (h'(t)) (the slope of the tangent line).
On the interval ((1.5, 2)), the graph is concave up (it is shaped like a cup).
Mathematically:
– At (G) ((t=1.5)), the slope is at its steepest negative value.
– At (J) ((t=2)), the slope is zero (horizontal tangent at the minimum).
– As the slope goes from a negative number (e.g., (-2)) to (0), the value of the slope is increasing.
Answer: The rate of change of (h) is increasing on the interval ((t_1, t_2)).
▶️ Answer/Explanation
(A)
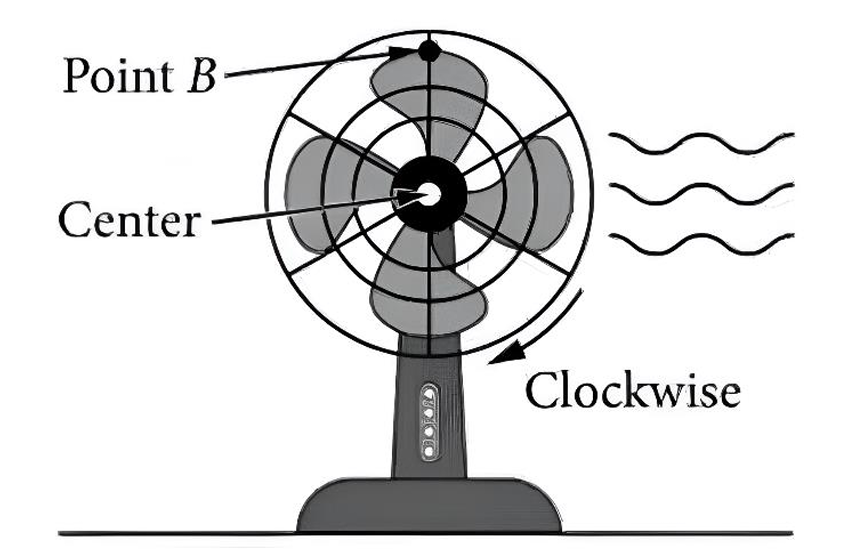
The center of the fan is $d = 20$ inches above the table. The radius of the fan blade is $r = 6$ inches, which is the amplitude $a$. The maximum height is $20 + 6 = 26$ inches and the minimum height is $20 – 6 = 14$ inches. The fan completes $5$ rotations per second, so the period is $T = \frac{1}{5} = 0.2$ seconds. Point $B$ starts at the maximum height at $t = 0$, so point $F$ is $(0, 26)$. Point $G$ is at the midline after $\frac{1}{4}$ of a period: $(\frac{0.2}{4}, 20) = (0.05, 20)$. Point $J$ is at the minimum after $\frac{1}{2}$ of a period: $(\frac{0.2}{2}, 14) = (0.1, 14)$. Point $K$ is at the midline after $\frac{3}{4}$ of a period: $(\frac{3 \times 0.2}{4}, 20) = (0.15, 20)$. Point $P$ is at the maximum after $1$ full period: $(0.2, 26)$. The coordinates are: $F(0, 26)$, $G(0.05, 20)$, $J(0.1, 14)$, $K(0.15, 20)$, and $P(0.2, 26)$.
(B)
The amplitude is $a = 6$. The vertical shift (midline) is $d = 20$. The period is $T = 0.2$, so the frequency constant is $b = \frac{2\pi}{0.2} = 10\pi$. Since the function starts at a maximum at $t=0$, it follows $h(t) = 6 \cos(10\pi t) + 20$. To write this as a sine function $h(t) = 6 \sin(10\pi(t + c)) + 20$, we use the identity $\cos(\theta) = \sin(\theta + \frac{\pi}{2})$. Setting $10\pi(t + c) = 10\pi t + \frac{\pi}{2}$, we find $10\pi c = \frac{\pi}{2}$, which gives $c = \frac{1}{20} = 0.05$. Thus, $a = 6$, $b = 10\pi$, $c = 0.05$, and $d = 20$.
(C)
(i) On the interval $(t_1, t_2)$, which is $(0.15, 0.2)$, the graph moves from the midline (point $K$) up to the maximum (point $P$). Throughout this interval, $h(t)$ is between $20$ and $26$, so it is positive. The function is moving upwards, so it is increasing. The correct option is (A) $h$ is positive and increasing.
(ii) On the interval $(t_1, t_2)$, the graph is concave down as it levels off toward the maximum. The slope (rate of change) is positive because the function is increasing. However, the slope is becoming less steep as it approaches the horizontal tangent at point $P$. Therefore, the rate of change of $h$ is decreasing on the interval $(t_1, t_2)$.