Home / AP® Exam / AP® PreCalculus / AP® Precalculus

AP Precalculus -3.5 Sinusoidal Functions- MCQ Exam Style Questions - Effective Fall 2023

AP Precalculus -3.5 Sinusoidal Functions- MCQ Exam Style Questions – Effective Fall 2023

AP Precalculus -3.5 Sinusoidal Functions- MCQ Exam Style Questions – AP Precalculus- per latest AP Precalculus Syllabus.

AP Precalculus – MCQ Exam Style Questions- All Topics

Question 


The figure shows the graph of a sinusoidal function \( g \). What are the values of the period and amplitude of \( g \)?
(A) The period is 4, and the amplitude is 3.
(B) The period is 8, and the amplitude is 3.
(C) The period is 4, and the amplitude is 6.
(D) The period is 8, and the amplitude is 6.
▶️ Answer/Explanation
Detailed solution

From the graph:
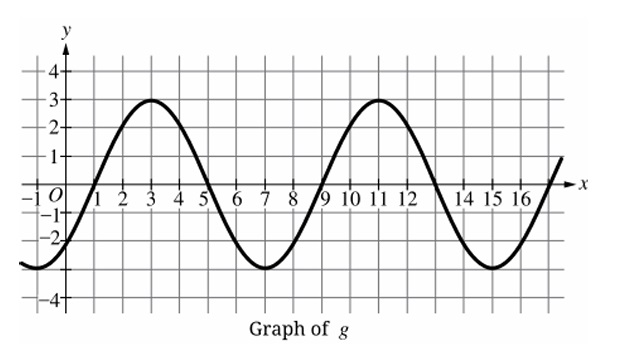
– Maximum \( g_{\text{max}} = 3 \), Minimum \( g_{\text{min}} = -3 \)
– Amplitude = \( \frac{g_{\text{max}} – g_{\text{min}}}{2} = \frac{3 – (-3)}{2} = 3 \)
– Consecutive maxima occur at \( x = 3 \) and \( x = 11 \), so period = \( 11 – 3 = 8 \)
– Consecutive minima occur at \( x = -1 \) and \( x = 7 \), also giving period = \( 7 – (-1) = 8 \)
Answer: (B)

Question 


The graph of the function \( h \) is given in the \( xy \)-plane. If \( h(x) = a \tan(bx) + 10 \), where \( a \) and \( b \) are constants, which of the following is true?
(A) \( a > 0 \) and \( b > 1 \)
(B) \( a > 0 \) and \( 0 < b < 1 \)
(C) \( a < 0 \) and \( b > 1 \)
(D) \( a < 0 \) and \( 0 < b < 1 \)
▶️ Answer/Explanation
Detailed solution

From the graph:
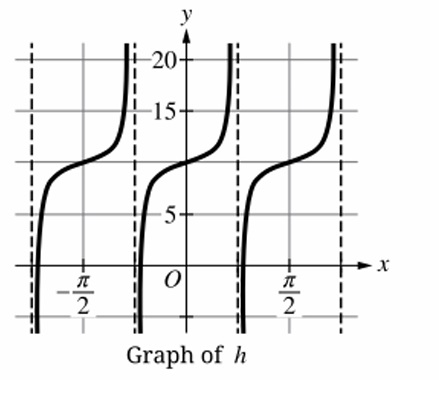
– The standard tangent curve increases through its midline; here it also increases (no vertical reflection), so \( a > 0 \).
– The period of \( h \) is shorter than \( \pi \) (the period of \( \tan x \)). Since period = \( \frac{\pi}{b} \), we have \( \frac{\pi}{b} < \pi \) → \( b > 1 \).
Thus \( a > 0 \) and \( b > 1 \).
Answer: (A)

Question 

The function \( g \) is given by \( g(x) = 3 \csc(\pi(x + 2)) – 1 \). Which of the following describes the range of \( g \)?
(A) The range of \( g \) is \([-3, 3]\).
(B) The range of \( g \) is \((-\infty, -2] \cup [4, \infty)\).
(C) The range of \( g \) is \((-\infty, -3] \cup [3, \infty)\).
(D) The range of \( g \) is \((-\infty, -4] \cup [2, \infty)\).
▶️ Answer/Explanation
Detailed solution

\( g(x) = 3\csc(\pi(x+2)) – 1 \).
Cosecant function: \( \csc u \) has range \( (-\infty, -1] \cup [1, \infty) \).
Multiplying by 3 stretches vertically: range becomes \( (-\infty, -3] \cup [3, \infty) \).
Subtracting 1 shifts down by 1: range becomes \( (-\infty, -4] \cup [2, \infty) \).
Answer: (D)

Question 

The function \( p \) is given by \( p(\theta) = 3\tan\left(\frac{\pi}{2}(\theta + 1)\right) – 4 \). What is the period of \( p \)?
(A) \( \frac{2}{\pi} \)
(B) \( \frac{\pi}{2} \)
(C) 2
(D) 4
▶️ Answer/Explanation
Detailed solution

For \( y = \tan(k\theta) \), the period is \( \frac{\pi}{|k|} \).
Here \( p(\theta) = 3\tan\left(\frac{\pi}{2}(\theta + 1)\right) – 4 \).
The coefficient of \( \theta \) inside the tangent is \( \frac{\pi}{2} \), so \( k = \frac{\pi}{2} \).
Period \( = \frac{\pi}{k} = \frac{\pi}{\pi/2} = 2 \).
Answer: (C)

Question 

The function \( f \) is given by \( f(x) = a\tan(bx) \), where \( a \) and \( b \) are constants. Which of the following is true about the period of \( f \)?
(A) Both \( a \) and \( b \) have an impact on the period.
(B) Only \( a \) has an impact on the period.
(C) Only \( b \) has an impact on the period.
(D) Neither \( a \) nor \( b \) has an impact on the period.
▶️ Answer/Explanation
Detailed solution

For \( y = \tan(bx) \), the period is \( \frac{\pi}{|b|} \).
The amplitude-like factor \( a \) affects vertical stretching but not the period.
Thus only \( b \) affects the period.
Answer: (C)

Question 

The function \( f \) is defined by \( f(x) = a \sin(b(x + c)) + d \), for constants \( a, b, c, \) and \( d \). In the \( xy \)-plane, the points (2, 2) and (4, 4) represent a minimum value and a maximum value, respectively, on the graph of \( f \). What are the values of \( a \) and \( d \)?
(A) \( a = 1 \) and \( d = 3 \)
(B) \( a = 1 \) and \( d = 2 \)
(C) \( a = 2 \) and \( d = 3 \)
(D) \( a = 2 \) and \( d = 2 \)
▶️ Answer/Explanation
Detailed solution

Midline \( d \) is halfway between max and min:
\[ d = \frac{4 + 2}{2} = 3 \]
Amplitude \( a \) is half the difference:
\[ a = \frac{4 – 2}{2} = 1 \]
Thus \( a = 1 \), \( d = 3 \).
Answer: (A)

Question 

The function \( f \) is given by \( f(x) = 2\sin(4x) + \cos(2x) \). Using the period of \( f \), which of the following is the number of complete cycles of the graph of \( f \) in the \( xy \)-plane on the interval \( 0 \leq x \leq 1000 \)?
(A) 159
(B) 318
(C) 602
(D) 636
▶️ Answer/Explanation
Detailed solution

Find the period of \( f(x) = 2\sin(4x) + \cos(2x) \).
• \( 2\sin(4x) \) has period \( \frac{2\pi}{4} = \frac{\pi}{2} \).
• \( \cos(2x) \) has period \( \frac{2\pi}{2} = \pi \).
The combined function \( f \) is periodic with period equal to the least common multiple of \( \frac{\pi}{2} \) and \( \pi \), which is \( \pi \).
Thus the period of \( f \) is \( \pi \).
Number of complete cycles in \( 0 \leq x \leq 1000 \):
\[ \frac{1000}{\pi} \approx 318.31 \]
So there are 318 complete cycles.
Answer: (B)

Question 

Is the function $f(x) = \sin 3\theta – \cos 3\theta$ a sinusoidal function on all its domain?
a. No, since it has both a sine and a cosine, while a sinusoidal function can only have one sine or one cosine function.
b. No, since it has a sine being subtracted by a cosine function, while a sinusoidal function has it being added together.
c. Yes, since the sine and cosine functions have the same input angle, $3\theta$.
d. Yes, since it incorporates trigonometric functions and not inverse trigonometric functions.
▶️ Answer/Explanation
Detailed solution

The correct answer is c.
Any linear combination of a sine and cosine with the same frequency results in a single shifted sinusoid.
Using the identity $A\sin(Bx) + B\cos(Bx) = R\sin(Bx + \phi)$, we can rewrite the function.
In this case, both terms share the same angular frequency (or input angle) of $3\theta$.
The function $f(x) = \sin 3\theta – \cos 3\theta$ can be simplified to $\sqrt{2}\sin(3\theta – 45^\circ)$.
Because it can be expressed as a single sine wave, it is classified as a sinusoidal function.
Options a and b are incorrect because they misunderstand the additive properties of waves.

Question 

Which of the following characteristics of $f(x) = -3\sin(3x – 3\pi)$ is true?

i. $f(x)$ is odd
ii. $f(x)$ has an amplitude of $6$
iii. $f(x)$ has a period of $\frac{2\pi}{3}$

a. i and iii only
b. i only
c. iii only
d. i, ii, and iii only
▶️ Answer/Explanation
Detailed solution

The function is $f(x) = -3\sin(3(x – \pi))$, which simplifies using $\sin(\theta – 3\pi) = -\sin(\theta)$ to $f(x) = 3\sin(3x)$.
Checking (i): $f(-x) = 3\sin(-3x) = -3\sin(3x) = -f(x)$, so the function is odd.
Checking (ii): The amplitude is $|a| = |-3| = 3$, so the statement “amplitude of $6$” is false.
Checking (iii): The period is calculated as $T = \frac{2\pi}{|b|} = \frac{2\pi}{3}$, so this statement is true.
Since statements i and iii are correct, the correct option is a.

Question 

The figure shows the graph of a sinusoidal function \( f \). Which of the following values is the period of \( f \)?
(A) \( 1 \)
(B) \( 3 \)
(C) \( \pi \)
(D) \( 2\pi \)
▶️ Answer/Explanation
Detailed solution

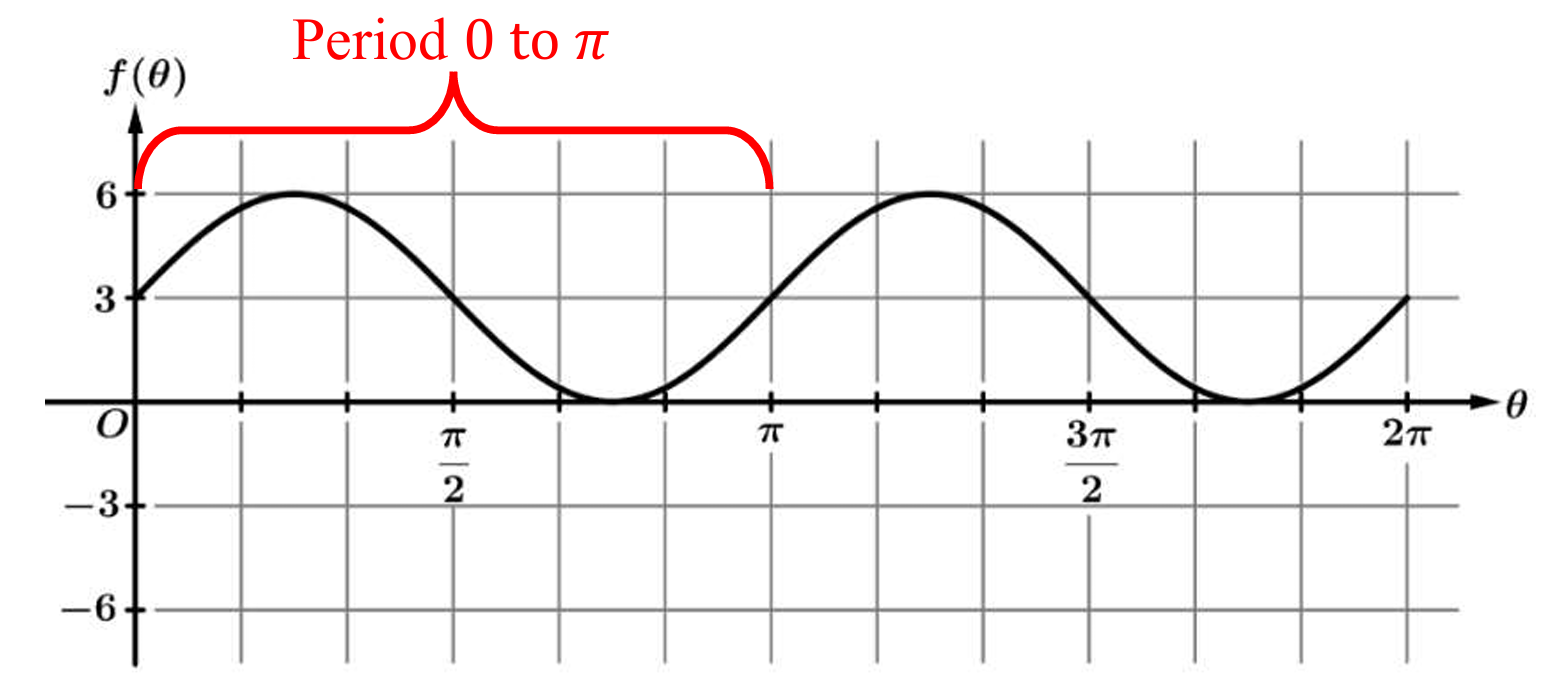
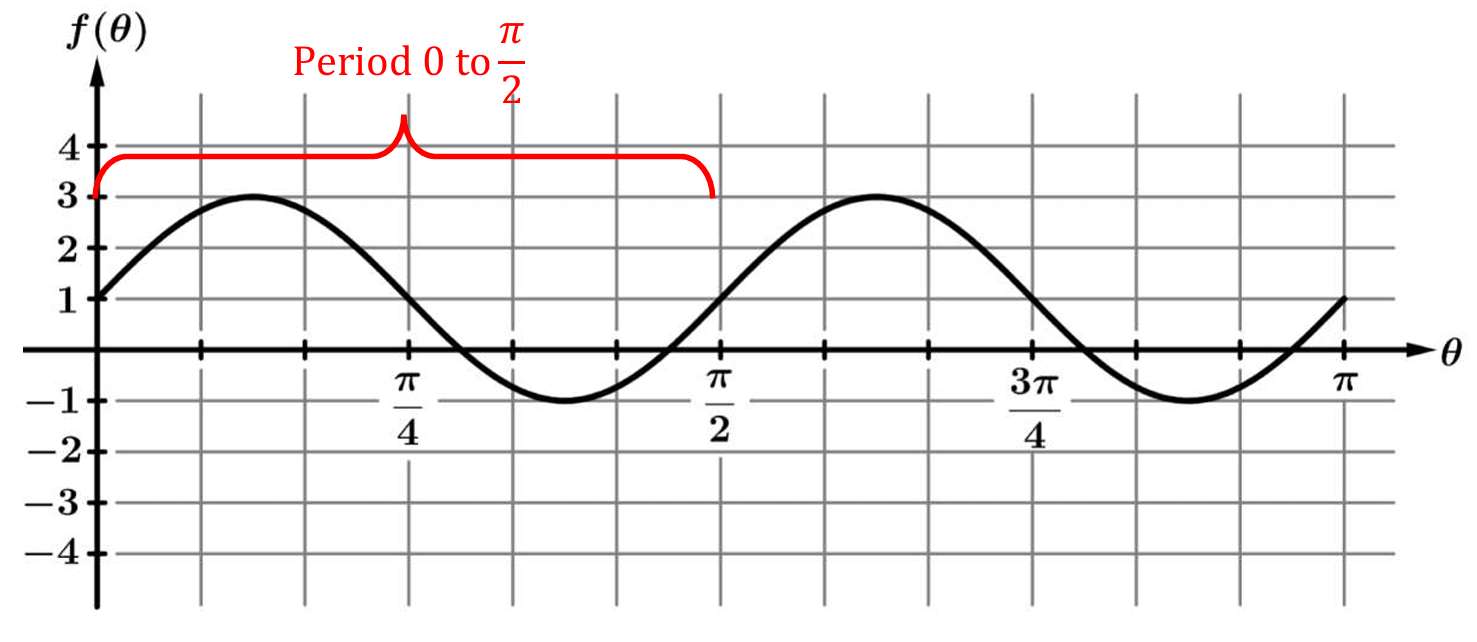
The period of a sinusoidal function is defined as the horizontal length of one complete cycle of the graph.
To determine this, identify a starting point on the graph, such as the y-intercept at \( \theta = 0 \).
At \( \theta = 0 \), the graph is at the midline \( y=3 \) and is sloping upwards.
Trace the graph along the horizontal axis until this pattern (midline value with upward slope) repeats.
The graph completes a full wave—reaching a maximum, crossing the midline, reaching a minimum, and returning to the midline—at \( \theta = \pi \).
Therefore, the length of the period is \( \pi – 0 = \pi \).
As highlighted by the red brace in the image, the interval from \( 0 \) to \( \pi \) represents one full period.

Correct Option: (C)

Question 

The figure shows the graph of a sinusoidal function \( g \). What is the amplitude of \( g \)?
(A) 1
(B) 2
(C) 3
(D) 4
▶️ Answer/Explanation
Detailed solution

First, identify the maximum and minimum values of the function \( g(\theta) \) from the graph.
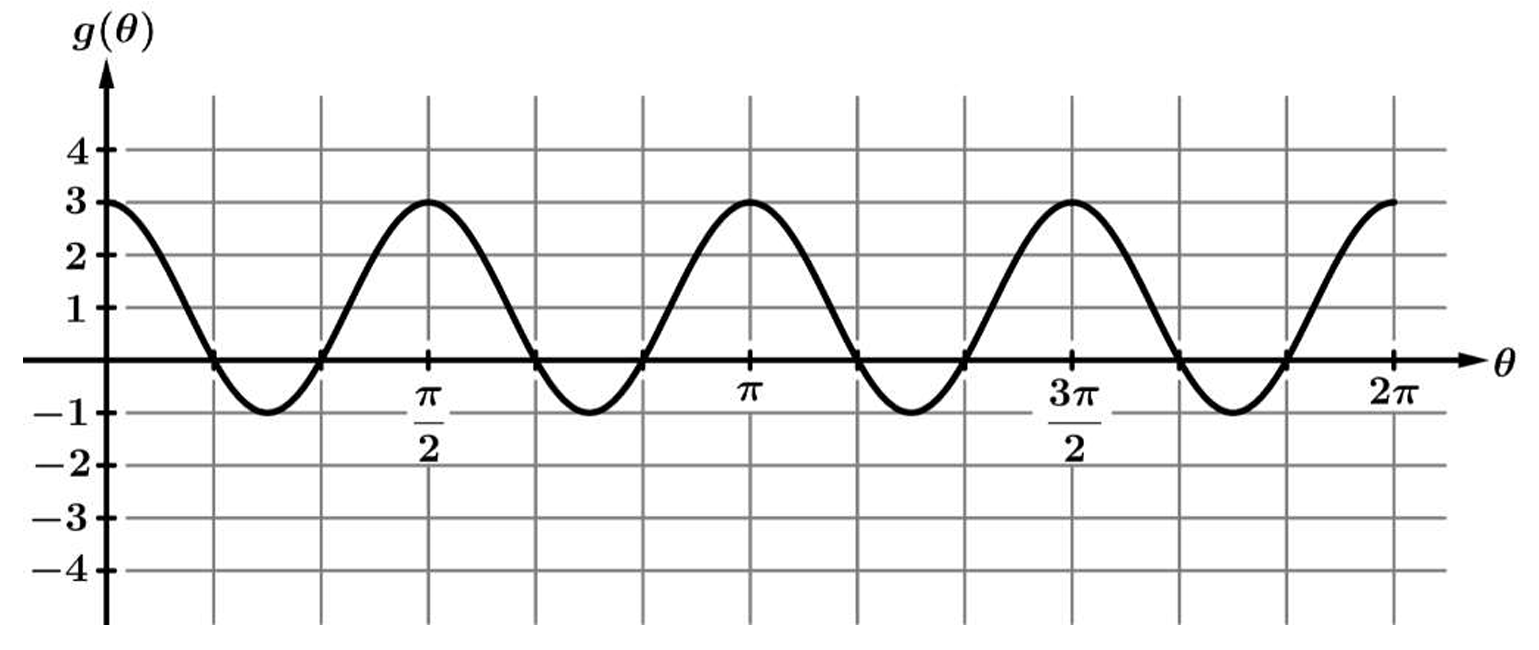
The maximum value (peak) is \( y_{\text{max}} = 3 \).
The minimum value (trough) is \( y_{\text{min}} = -1 \).
The amplitude of a sinusoidal function is half the difference between its maximum and minimum values.
Using the formula: \( \text{Amplitude} = \frac{1}{2}(\text{max} – \text{min}) \).
Substitute the values: \( \text{Amplitude} = \frac{1}{2}(3 – (-1)) = \frac{1}{2}(4) \).
Therefore, \( \text{Amplitude} = 2 \).
The correct option is (B).

Question 

The graph of the sinusoidal function \( g \) is shown in the figure above. The function \( g \) can be written as \( g(\theta) = a \sin(\theta) + d \). What are the values of the constants \( a \) and \( d \)?
(A) \( a = -2 \) and \( d = -2 \)
(B) \( a = -2 \) and \( d = 2 \)
(C) \( a = 2 \) and \( d = -2 \)
(D) \( a = 2 \) and \( d = 2 \)
▶️ Answer/Explanation
Detailed solution

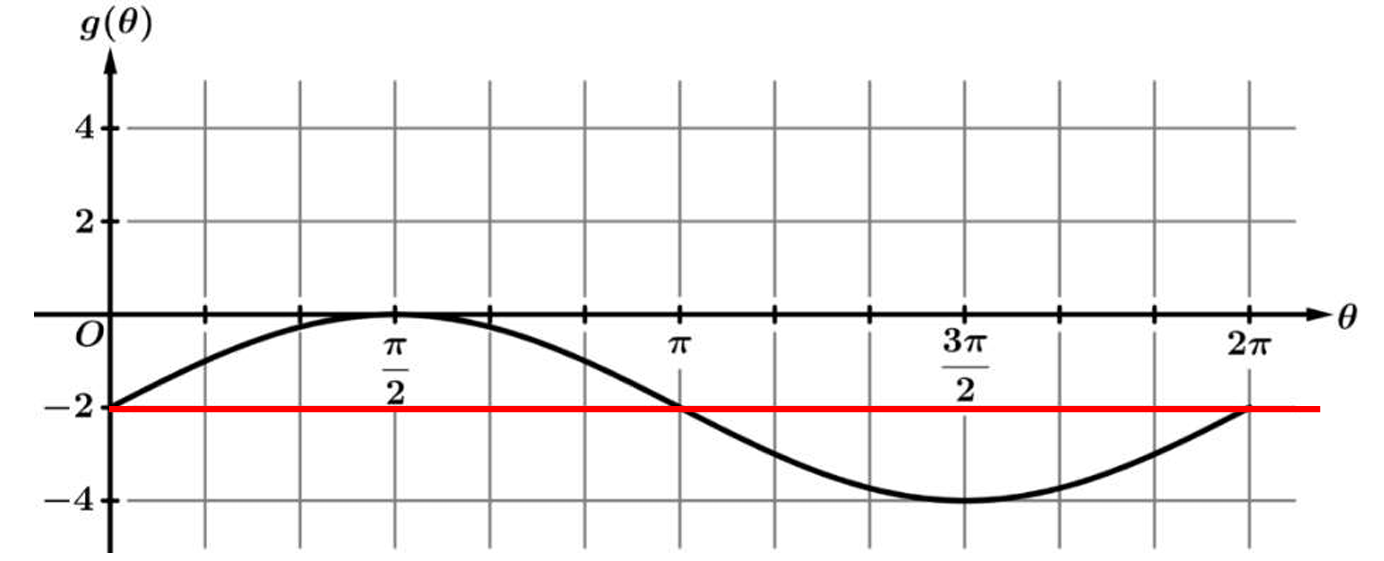
From the graph, the maximum y-value is \( 0 \) and the minimum y-value is \( -4 \).
The constant \( d \) is the midline (vertical shift), found by averaging the max and min: \( d = \frac{0 + (-4)}{2} = -2 \).
The constant \( a \) is the amplitude, found by taking half the distance between max and min: \( a = \frac{0 – (-4)}{2} = \frac{4}{2} = 2 \).
Since the graph starts at the midline and goes up (like a standard sine wave), \( a \) is positive.
Therefore, the correct values are \( a = 2 \) and \( d = -2 \).
Correct Option: (C)

Question 

The graph of the sinusoidal function \(h\) is shown in the figure above. The function \(h\) can be written as \(h(\theta) = a\cos(b\theta) – 2\). What are the values of the constants \(a\) and \(b\)?
(A) \(a = 6\) and \(b = \frac{1}{2}\)
(B) \(a = 12\) and \(b = \frac{1}{2}\)
(C) \(a = 6\) and \(b = 2\)
(D) \(a = 12\) and \(b = 2\)
▶️ Answer/Explanation
Detailed solution
Identify the maximum and minimum values from the graph: \(y_{\text{max}} = 4\) and \(y_{\text{min}} = -8\).
Calculate the amplitude \(a\) using the formula \(a = \frac{\text{max} – \text{min}}{2}\).
Substitute the known values: \(a = \frac{4 – (-8)}{2} = \frac{12}{2} = 6\).
Identify the period \(T\) of the function from the graph, which shows one full cycle from \(0\) to \(\pi\), so \(T = \pi\).
Use the period formula \(b = \frac{2\pi}{T}\) to determine the frequency constant.
Calculate \(b\): \(b = \frac{2\pi}{\pi} = 2\).
Therefore, the constants are \(a = 6\) and \(b = 2\).
This corresponds to option (C).

Question 

The figure shows the graph of a sinusoidal function \(f\). What are the values of the period and amplitude of \(f\)?
(A) The period is \(\pi\) , and the amplitude is \(1\) .
(B) The period is \(\pi\) , and the amplitude is \(2\) .
(C) The period is \(\frac{\pi}{2}\) , and the amplitude is \(1\) .
(D) The period is \(\frac{\pi}{2}\) , and the amplitude is \(2\) .
▶️ Answer/Explanation
Detailed solution

From the graph, identify the maximum value as \(3\) and the minimum value as \(-1\).
The amplitude is half the distance between the maximum and minimum values: \(\frac{1}{2}(\text{max} – \text{min})\).
Substituting the values, we get: \(\text{Amplitude} = \frac{1}{2}(3 – (-1)) = \frac{1}{2}(4) = 2\).
Next, identify the period by finding the length of one complete cycle.
The graph completes one full wave starting from \(0\) and ending at \(\frac{\pi}{2}\).
Therefore, the period is \(\frac{\pi}{2}\).
Matching these results with the options, we find the period is \(\frac{\pi}{2}\) and the amplitude is \(2\).
Correct Option: (D)

Question 

The graph of the sinusoidal function \( k \) is shown in the figure above. The function \( k \) can be written as \( k(\theta) = a \sin(\theta) + d \). What are the values of the constants \( a \) and \( d \)?
(A) \( a = 2 \) and \( d = 4 \)
(B) \( a = 2 \) and \( d = 6 \)
(C) \( a = 4 \) and \( d = 2 \)
(D) \( a = 6 \) and \( d = 2 \)
▶️ Answer/Explanation
Detailed solution

The correct answer is (C).
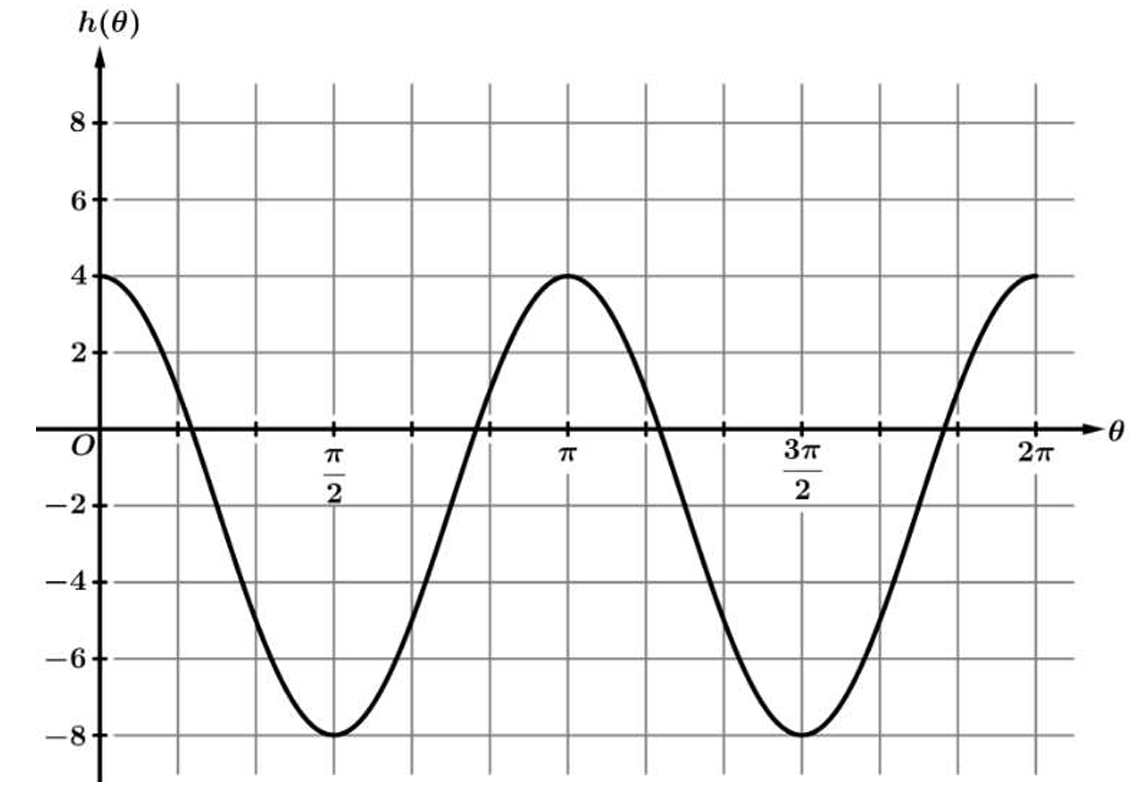
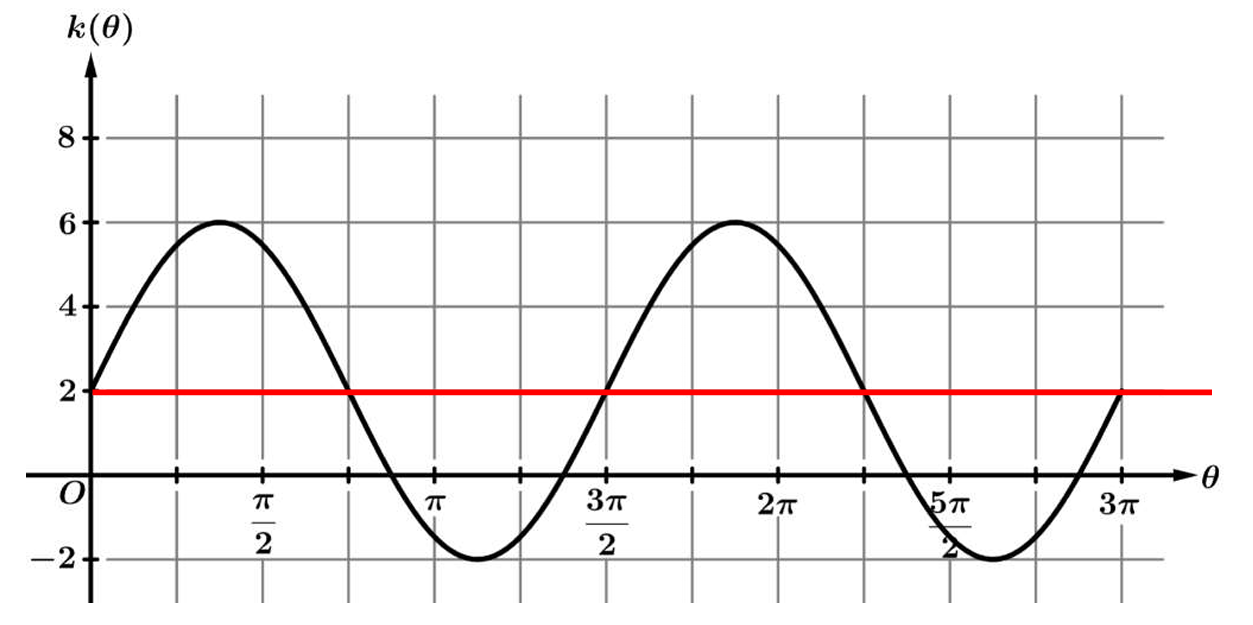
From the graph, we identify the maximum value as \( y_{\text{max}} = 6 \) and the minimum value as \( y_{\text{min}} = -2 \).
The constant \( d \) represents the midline (vertical shift), which is the average of the maximum and minimum values: \( d = \frac{6 + (-2)}{2} = \frac{4}{2} = 2 \).
The constant \( a \) represents the amplitude, which is half the distance between the maximum and minimum values: \( a = \frac{6 – (-2)}{2} = \frac{8}{2} = 4 \).
Thus, the values are \( a = 4 \) and \( d = 2 \), matching option (C).

Question 

The figure shows the graph of a sinusoidal function \(g\). What are the values of the period and amplitude of \(g\)?
(A) The period is \(2\), and the amplitude is \(2\).
(B) The period is \(2\), and the amplitude is \(4\).
(C) The period is \(4\), and the amplitude is \(2\).
(D) The period is \(4\), and the amplitude is \(4\).
▶️ Answer/Explanation
Detailed solution
To find the amplitude, we identify the maximum and minimum values from the graph.
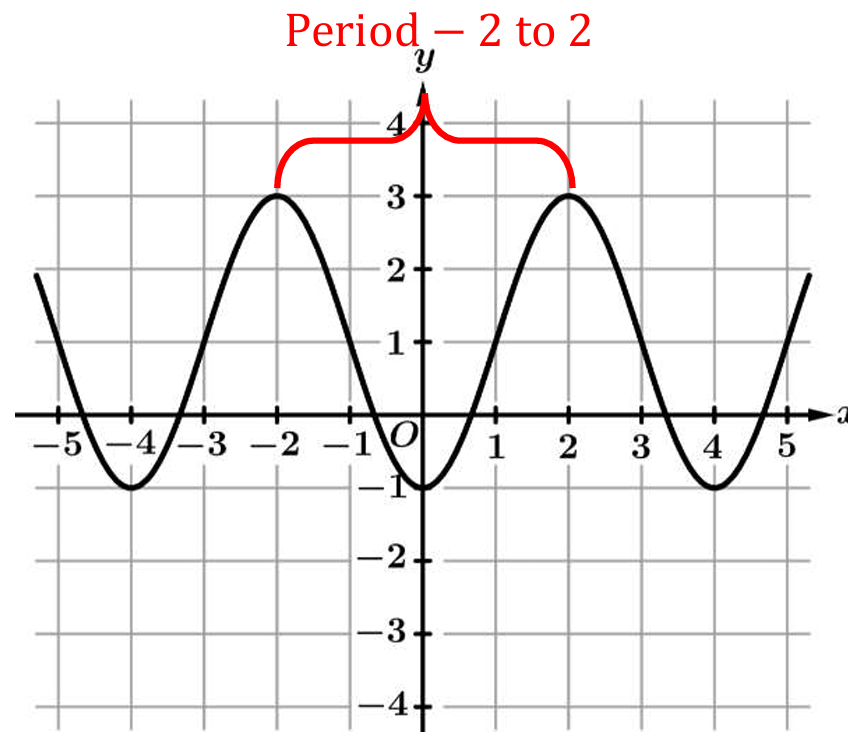
The maximum value is \(3\) and the minimum value is \(-1\).
Using the formula \(\text{Amplitude} = \frac{1}{2}(\text{max} – \text{min})\), we get \(\frac{1}{2}(3 – (-1)) = \frac{1}{2}(4) = 2\).
To find the period, we measure the horizontal distance between two consecutive peaks.
The peaks in the graph occur at \(x = -2\) and \(x = 2\).
The period is the difference: \(2 – (-2) = 4\).
Thus, the period is \(4\) and the amplitude is \(2\), corresponding to option (C).

Question 

The graph of the sinusoidal function \( f \) is shown in the figure above. The function can be written as \( f(\theta) = a \sin(b\theta) + 2 \). What are the values of the constants \( a \) and \( b \)?
(A) \( a = 4 \) and \( b = 8 \)
(B) \( a = 4 \) and \( b = \frac{\pi}{4} \)
(C) \( a = 6 \) and \( b = 8 \)
(D) \( a = 6 \) and \( b = \frac{\pi}{4} \)
▶️ Answer/Explanation
Detailed solution

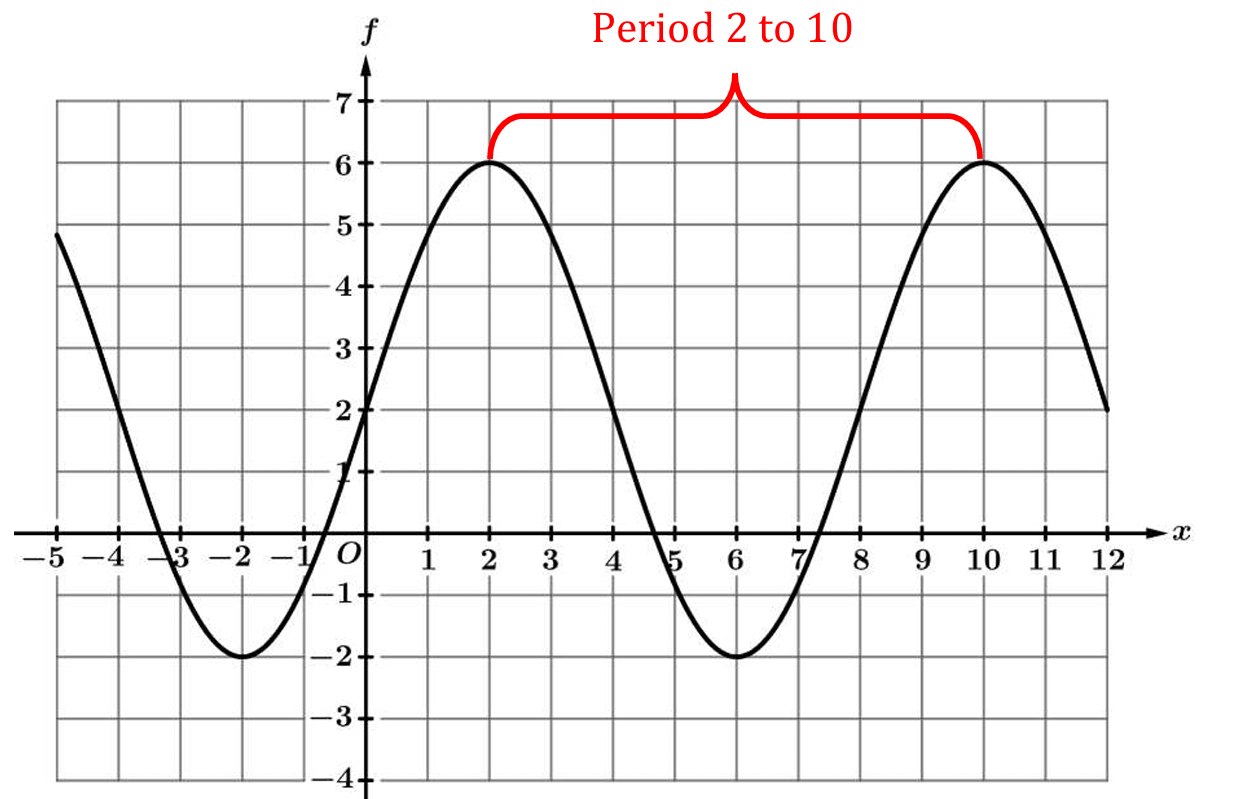
The amplitude \( a \) corresponds to the vertical stretch from the midline.
From the graph, the maximum value is \( 6 \) and the minimum value is \( -2 \).
Calculate \( a = \frac{\text{max} – \text{min}}{2} = \frac{6 – (-2)}{2} = \frac{8}{2} = 4 \).
The period is the horizontal length of one complete cycle, found between two peaks.
The peaks occur at \( x = 2 \) and \( x = 10 \), so the Period \( = 10 – 2 = 8 \).
The formula for the period of a sine function is \( \frac{2\pi}{b} \).
Set \( \frac{2\pi}{b} = 8 \) and solve for \( b \): \( b = \frac{2\pi}{8} = \frac{\pi}{4} \).
Thus, \( a = 4 \) and \( b = \frac{\pi}{4} \), which matches option (B).

Question 

The sinusoidal function \( h \) has a minimum at the point \( (2\pi, -1) \). The first maximum after reaching this minimum value occurs at the point \( (5\pi, 7) \). What are the values of the period and amplitude of \( h \)?
(A) The period is \( 6\pi \), and the amplitude is \( 4 \).
(B) The period is \( 6\pi \), and the amplitude is \( 8 \).
(C) The period is \( 12\pi \), and the amplitude is \( 4 \).
(D) The period is \( 12\pi \), and the amplitude is \( 8 \).
▶️ Answer/Explanation
Detailed solution

The amplitude is half the difference between the maximum and minimum values:
\( \text{Amplitude} = \frac{1}{2}(\text{max} – \text{min}) = \frac{1}{2}(7 – (-1)) = \frac{1}{2}(8) = 4 \).
The horizontal distance between a minimum and the consecutive maximum represents half of the period:
\( \text{Half Period} = 5\pi – 2\pi = 3\pi \).
To find the full period, we multiply this difference by \( 2 \):
\( \text{Period} = 2 \times 3\pi = 6\pi \).
Therefore, the period is \( 6\pi \) and the amplitude is \( 4 \), which corresponds to option (A).

Question 

The sinusoidal function \( k \) has a minimum at the point \( \left(\frac{\pi}{2}, -12\right) \). The first maximum after reaching this minimum value occurs at the point \( (\pi, -2) \). Which of the following gives the period and the midline of \( k \)?
(A) The period is \( \frac{\pi}{2} \), and the midline is \( y = -7 \).
(B) The period is \( \frac{\pi}{2} \), and the midline is \( y = 5 \).
(C) The period is \( \pi \), and the midline is \( y = -7 \).
(D) The period is \( \pi \), and the midline is \( y = 5 \).
▶️ Answer/Explanation
Detailed solution

To find the midline, we take the average of the maximum and minimum values: \( y = \frac{\text{max} + \text{min}}{2} \).
Substituting the given \(y\)-values: \( y = \frac{-2 + (-12)}{2} = \frac{-14}{2} = -7 \).
The horizontal distance from a minimum to the next maximum corresponds to half of the period.
Calculate this distance using the \(x\)-coordinates: \( \pi – \frac{\pi}{2} = \frac{\pi}{2} \).
Since half the period is \( \frac{\pi}{2} \), the full period is \( 2 \times \frac{\pi}{2} = \pi \).
Thus, the function has a period of \( \pi \) and a midline of \( y = -7 \), matching option (C).

Question 

The function \( g \) is defined by \( g(x) = a \sin(b(x + c)) + d \), for constants \( a, b, c, \) and \( d \). In the \( xy \)-plane, the points \( (3, -1) \) and \( (7, 3) \) represent a minimum value and a maximum value, respectively, on the graph of \( g \). What are the values of \( a \) and \( d \)?
(A) \( a = 2 \) and \( d = -1 \)
(B) \( a = 2 \) and \( d = 1 \)
(C) \( a = 4 \) and \( d = -1 \)
(D) \( a = 4 \) and \( d = 1 \)
▶️ Answer/Explanation
Detailed solution

From the given coordinates, the maximum value is \( y_{\text{max}} = 3 \) and the minimum value is \( y_{\text{min}} = -1 \).
The constant \( d \) represents the midline (vertical shift), which is the average of the maximum and minimum values.
Calculation for \( d \): \( d = \frac{y_{\text{max}} + y_{\text{min}}}{2} = \frac{3 + (-1)}{2} = \frac{2}{2} = 1 \).
The constant \( a \) represents the amplitude, which is half the distance between the maximum and minimum values.
Calculation for \( a \): \( a = \frac{y_{\text{max}} – y_{\text{min}}}{2} = \frac{3 – (-1)}{2} = \frac{4}{2} = 2 \).
Therefore, the values are \( a = 2 \) and \( d = 1 \).
This corresponds to option (B).

Question 

The function \( h \) is defined by \( h(x) = a \sin(b(x+c)) + d \), for constants \( a, b, c, \) and \( d \). In the \( xy \)-plane, the points \( (2, 4) \) and \( (4, 10) \) represent a minimum value and a maximum value, respectively, on the graph of \( h \). What is the value of \( b \)?
(A) \( b = 2 \)
(B) \( b = 4 \)
(C) \( b = \frac{\pi}{2} \)
(D) \( b = \pi \)
▶️ Answer/Explanation
Detailed solution

The horizontal distance between a consecutive minimum and maximum represents half of the period.
Given the minimum is at \( x = 2 \) and the maximum is at \( x = 4 \), the half-period is \( 4 – 2 = 2 \).
Thus, the full period of the function is \( 2 \times 2 = 4 \).
The formula relating the period to the coefficient \( b \) is \( \text{Period} = \frac{2\pi}{b} \).
Setting up the equation: \( 4 = \frac{2\pi}{b} \).
Solving for \( b \), we get \( b = \frac{2\pi}{4} \).
Simplifying the fraction results in \( b = \frac{\pi}{2} \).

The correct option is (C).

Question 

The function \(f\) is defined by \(f(x) = a \cos(b(x+c)) + d\), for constants \(a, b, c,\) and \(d\). In the \(xy\)-plane, the points \((\pi, 6)\) and \((2\pi, 2)\) represent a maximum value and a minimum value, respectively, on the graph of \(f\). What are the values of \(b\) and \(d\)?
(A) \(b = 2\pi\) and \(d = 2\)
(B) \(b = 1\) and \(d = 2\)
(C) \(b = 2\pi\) and \(d = 4\)
(D) \(b = 1\) and \(d = 4\)
▶️ Answer/Explanation
Detailed solution

The vertical shift \(d\) (midline) is the average of the maximum and minimum values.
\(d = \frac{\text{max} + \text{min}}{2} = \frac{6 + 2}{2} = \frac{8}{2} = 4\).
The distance from a maximum at \(x = \pi\) to the next minimum at \(x = 2\pi\) is half the period.
Half-period \(= 2\pi – \pi = \pi\), so the full period is \(2\pi\).
The coefficient \(b\) is calculated using the period formula: \(b = \frac{2\pi}{\text{Period}}\).
Substituting the period: \(b = \frac{2\pi}{2\pi} = 1\).
Therefore, \(b = 1\) and \(d = 4\).

Question 

The function \( k \) is defined by \( k(x) = a \cos(b(x+c)) + d \), for constants \( a, b, c, \) and \( d \). In the \( xy \)-plane, the points \( \left( \frac{\pi}{4}, 10 \right) \) and \( \left( \frac{3\pi}{4}, 40 \right) \) represent a minimum value and a maximum value, respectively, on the graph of \( k \).
What are the period and amplitude of the function \( k \)?
(A) The period is \( \frac{\pi}{2} \) and the amplitude is \( 15 \).
(B) The period is \( \frac{\pi}{2} \) and the amplitude is \( 30 \).
(C) The period is \( \pi \) and the amplitude is \( 15 \).
(D) The period is \( \pi \) and the amplitude is \( 30 \).
▶️ Answer/Explanation
Detailed solution

The amplitude is half the difference between the maximum value \( 40 \) and the minimum value \( 10 \).

Calculating the amplitude: \( \text{Amplitude} = \frac{1}{2}(\text{max} – \text{min}) = \frac{1}{2}(40 – 10) = \frac{30}{2} = 15 \).

The horizontal distance between the minimum at \( x = \frac{\pi}{4} \) and the maximum at \( x = \frac{3\pi}{4} \) represents half of the period.

Calculating half the period: \( \frac{3\pi}{4} – \frac{\pi}{4} = \frac{2\pi}{4} = \frac{\pi}{2} \).

Since \( \frac{\text{Period}}{2} = \frac{\pi}{2} \), multiplying by \( 2 \) gives the full period: \( \text{Period} = \pi \).

Therefore, the function has a period of \( \pi \) and an amplitude of \( 15 \), which corresponds to option (C).

Question 

At a coastal city, the height of the tide, in feet (ft), is modeled by the function (h), defined by (h(t) = 6.3\cos\left(\frac{\pi}{6}t\right)) for (0 \le t \le 12) hours. Based on the model, which of the following is true?
(A) The maximum height of the tide is 13.8 ft
(B) The maximum height of the tide occurs at (t = 6) hours
(C) The minimum height of the tide is 1 ft
(D) The minimum height of the tide occurs at (t = 12) hours
▶️ Answer/Explanation
Detailed solution

The function (h(t) = A\cos(Bt) + K) models the tide, where (A=6.3) and (B=\frac{\pi}{6}).
The period is \(\frac{2\pi}{B} = \frac{2\pi}{\pi/6} = 12\) hours.
A positive cosine function starts at its maximum at (t=0) and reaches the maximum again at (t=12).
The minimum value of a positive cosine function occurs halfway through the period at (t=6).
This incorrect phase behavior eliminates option (B) (which claims max at (t=6)) and option (D) (which claims min at (t=12)).
For option (A) to be true, the maximum height (K + 6.3) must equal (13.8), implying a vertical shift (K = 7.5).
Using (K=7.5), the minimum height would be (7.5 – 6.3 = 1.2), which makes option (C) incorrect (as it states 1 ft).
Thus, assuming the implied vertical shift, option (A) is the correct statement.

Correct Option: (A)

Question 

The function \(H\) models a periodic phenomenon. The maximum value of \(H\) is 8, which occurs at time \(t = 0\) hours. The period of \(H\) is 12 hours. For \(0 < t < 24\) hours, which of the following could be an expression for \(H(t)\)?
(A) \(3.5 \sin\left(\frac{\pi}{12}t\right) + 4.5\)
(B) \(3.5 \sin\left(\frac{\pi}{6}t\right) + 4.5\)
(C) \(3.5 \cos\left(\frac{\pi}{12}t\right) + 4.5\)
(D) \(3.5 \cos\left(\frac{\pi}{6}t\right) + 4.5\)
▶️ Answer/Explanation
Detailed solution

The correct answer is (D).

Since the maximum value occurs at \(t=0\), the function should involve cosine, as \(\cos(0)=1\) (maximum) while \(\sin(0)=0\) (midline).
This eliminates options (A) and (B), leaving only the cosine functions.
The period is given as 12 hours. The formula for period is \(P = \frac{2\pi}{B}\), where \(B\) is the coefficient of \(t\).
We solve for \(B\): \(12 = \frac{2\pi}{B} \Rightarrow B = \frac{2\pi}{12} = \frac{\pi}{6}\).
Option (C) has a coefficient of \(\frac{\pi}{12}\), which results in an incorrect period of 24.
Option (D) has the correct coefficient \(\frac{\pi}{6}\).
Checking the maximum value for (D): \(3.5\cos(0) + 4.5 = 3.5(1) + 4.5 = 8\), which is correct.

Question 

A sinusoidal function model \( y = f(x) \) is constructed from the data in the table and results in \( f(x) = a\sin(b(x + c)) + d \), where \( a \), \( b \), \( c \), and \( d \) are constants. Of the following, which is the best approximation for the value of \( b \)?
(A) 0.7
(B) 1
(C) 6
(D) 9
▶️ Answer/Explanation
Detailed solution

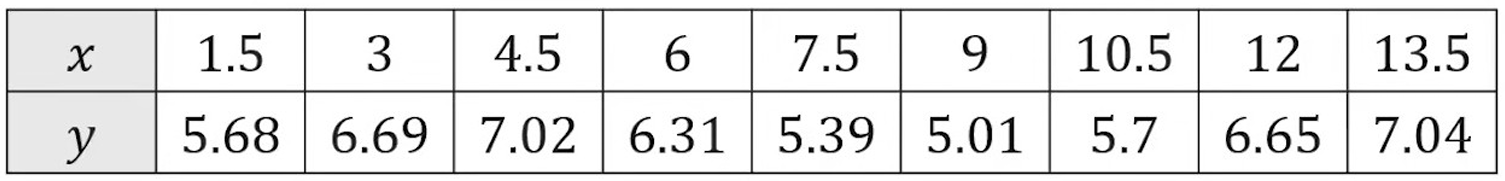
The constant \( b \) determines the frequency and is related to the period \( P \) by the formula \( b = \frac{2\pi}{P} \).
To find the period, we identify the distance between two consecutive peaks (maximum values) in the data.
The first peak occurs at \( x = 4.5 \) with \( y = 7.02 \), and the next peak is at \( x = 13.5 \) with \( y = 7.04 \).
Calculating the difference gives the period: \( P = 13.5 – 4.5 = 9 \).
Now, we substitute \( P = 9 \) into the formula for \( b \): \( b = \frac{2\pi}{9} \).
Approximating \( \pi \approx 3.14 \), we get \( b \approx \frac{6.28}{9} \approx 0.698 \).
Rounding to the nearest option, the value is approximately \( 0.7 \).

Question 

A circular clock face on a wall has hours marked with integers from \(1\) to \(12\) and the hour hand that rotates as time passes. The hour hand points to the number \(12\) at midnight. The height above the floor, in inches, of the tip of the hour hand at \(t\) hours after midnight is modeled by the periodic function \(y\). Values of \(y(t)\) at selected values of \(t\) are given in the table. For \(t \geq 0\), which of the following could be an expression for \(y(t)\)?
\(t\)
hours
\(0\)\(3\)\(6\)\(9\)\(12\)
\(y(t)\)
inches
\(78\)\(70\)\(62\)\(70\)\(78\)
(A) \(-8 \sin\left(\frac{\pi}{12}(t-3)\right) + 70\)
(B) \(-8 \sin\left(\frac{\pi}{6}(t-3)\right) + 70\)
(C) \(8 \cos\left(\frac{\pi}{12}(t-3)\right) + 70\)
(D) \(8 \cos\left(\frac{\pi}{6}(t-3)\right) + 70\)
▶️ Answer/Explanation
Detailed solution

The maximum height is \(78\) and the minimum is \(62\), so the vertical shift (midline) is \(\frac{78 + 62}{2} = 70\) and amplitude is \(78 – 70 = 8\).
The function repeats its values from \(t=0\) to \(t=12\), so the period is \(12\).
The coefficient \(B\) is calculated as \(\frac{2\pi}{\text{Period}} = \frac{2\pi}{12} = \frac{\pi}{6}\). This eliminates options (A) and (C).
We test the point \(t=0\) (where \(y=78\)) on the remaining options to find the correct expression.
For option (D): \(8 \cos\left(\frac{\pi}{6}(0-3)\right) + 70 = 8 \cos\left(-\frac{\pi}{2}\right) + 70 = 0 + 70 = 70\) (Incorrect).
For option (B): \(-8 \sin\left(\frac{\pi}{6}(0-3)\right) + 70 = -8 \sin\left(-\frac{\pi}{2}\right) + 70 = -8(-1) + 70 = 78\) (Correct).
Therefore, the correct expression is (B).

Question 

The figure shows a robotic arm rotating in a circular counterclockwise direction that completes one rotation every $2$ seconds. Point $S$ is on the tip of the arm, and point $X$ does not move. As the arm rotates at a constant speed, the height of $S$ above $X$ periodically increases and decreases. At time $t = 0$ seconds, $S$ is at its lowest position, $6$ inches directly below $X$. At its highest position, $S$ is $20$ inches directly above $X$.
The sinusoidal function $h$ models the height of $S$ above $X$, in inches, as a function of time $t$, in seconds. A positive value of $h(t)$ indicates $S$ is above $X$; a negative value of $h(t)$ indicates $S$ is below $X$.
Part A
The graph of $h$ and its dashed midline for two full cycles is shown. Five points, $F, G, J, K,$ and $P$, are labeled on the graph. Determine possible coordinates $(t, h(t))$ for the five points.
Part B
The function $h$ can be written in the form $h(t) = a \cos(b(t + c)) + d$. Find values of constants $a, b, c,$ and $d$.
Part C
Refer to the graph of $h$ in part (A). The $t$-coordinate of $K$ is $t_1$, and the $t$-coordinate of $P$ is $t_2$.
(i) On the interval $(t_1, t_2)$, which of the following is true about $h$?
      a. $h$ is positive and increasing.
      b. $h$ is positive and decreasing.
      c. $h$ is negative and increasing.
      d. $h$ is negative and decreasing.
(ii) Describe how the rate of change of $h$ is changing on the interval $(t_1, t_2)$.
▶️ Answer/Explanation
Detailed solution

Part A: Coordinates of Points

At $t = 0$, $S$ is at its minimum height $-6$ (below $X$).
The maximum height is $20$.
The midline $d = \frac{20 + (-6)}{2} = 7$.
The period is $2$ seconds.
The graph starts at a minimum at $t = 0$, reaches midline at $t = 0.5$, maximum at $t = 1$, midline at $t = 1.5$, and minimum at $t = 2$.
Based on the visual positions in the provided graph:
$F$ (first maximum): $(1, 20)$
$G$ (midline, decreasing): $(1.5, 7)$
$J$ (minimum): $(2, -6)$
$K$ (midline, increasing): $(2.5, 7)$
$P$ (second maximum): $(3, 20)$

Part B: Finding Constants

$a$ (Amplitude) $= \frac{20 – (-6)}{2} = 13$. Since we use $\cos$ and start at a minimum, $a = -13$ (or use a phase shift).
$d$ (Vertical shift/Midline) $= 7$.
$b$ (Frequency factor) $= \frac{2\pi}{\text{period}} = \frac{2\pi}{2} = \pi$.
$c$ (Phase shift): For $h(t) = a \cos(b(t+c)) + d$, if $a = -13$, then at $t=0$, $-13\cos(b(0+c))+7 = -6 \implies \cos(bc)=1 \implies c = 0$.
Final values: $a = -13, b = \pi, c = 0, d = 7$.

Part C: Interval Analysis

(i) At $K$, $h(t)=7$ and is increasing. At $P$, $h(t)=20$ (maximum).
On $(t_1, t_2)$, the height is between $7$ and $20$, so it is positive.
The graph is moving from the midline up to the peak, so it is increasing.
Correct Option: a

(ii) On the interval $(t_1, t_2)$, the graph is concave down as it approaches the maximum.
Therefore, the rate of change of $h$ (the slope) is decreasing.
It starts at its maximum positive value at $K$ and decreases toward zero at $P$.

Question 

A windshield wiper blade on a car window rotates back and forth. When the wiper blade is farthest to the left or farthest to the right, the measure of the angle formed by the wiper blade and the vertical centerline (see figure) is (0.75) radians.
At time (t=0) seconds, the wiper blade is farthest to the left. The wiper blade then rotates to the right and passes the vertical centerline. At time (t=1) seconds, the wiper blade is farthest to the right for the first time. Then, the wiper blade rotates left, passes the vertical centerline, and is farthest to the left again at time (t=2) seconds. As the wiper blade rotates, the measure of the angle formed by the wiper blade and the vertical centerline periodically increases and decreases.
The sinusoidal function (h) models the measure of the angle, in radians, formed by the wiper blade and the vertical centerline as a function of time (t), in seconds. A negative value of (h(t)) indicates the wiper blade is to the left of the vertical centerline; a positive value of (h(t)) indicates the wiper blade is to the right of the vertical centerline.
(A) The graph of (h) and its dashed midline for two full cycles is shown. Five points, (F, G, J, K), and (P) are labeled on the graph. No scale is indicated, and no axes are presented. Determine possible coordinates ((t, h(t))) for the five points (F, G, J, K), and (P).
(B) The function (h) can be written in the form (h(t) = a\sin(b(t+c)) + d). Find values of the constants (a, b, c), and (d).
(C) Refer to the graph of (h) in part (A). The (t)-coordinate of (G) is (t_1), and the (t)-coordinate of (J) is (t_2).
(i) On the interval ((t_1, t_2)), which of the following is true about (h)?
  • a. (h) is positive and increasing.
  • b. (h) is positive and decreasing.
  • c. (h) is negative and increasing.
  • d. (h) is negative and decreasing.
(ii) Describe how the rate of change of (h) is changing on the interval ((t_1, t_2)).
▶️ Answer/Explanation
Detailed solution

(A) Coordinates for the points (F, G, J, K), and (P)

First, we analyze the motion to establish the timeline:

  • At (t = 0), the blade is farthest left, so (h(0) = -0.75). This is a minimum value.
  • At (t = 1), the blade is farthest right, so (h(1) = 0.75). This is a maximum value.
  • At (t = 2), the blade is farthest left again, so (h(2) = -0.75). This is the next minimum.

The graph shows a sinusoidal wave. Let’s map the points based on this cycle:

  • Point (F): This is the first maximum peak shown. Since the motion starts at a minimum at (t=0), the first maximum occurs at (t=1).
    Coordinate: (F(1, 0.75))
  • Point (G): This point is on the midline (where (h(t)=0)) as the graph goes downwards from a maximum to a minimum. This occurs exactly halfway between the maximum at (t=1) and the minimum at (t=2).
    (t = \frac{1+2}{2} = 1.5).
    Coordinate: (G(1.5, 0))
  • Point (J): This is the minimum trough. We know the minimum occurs at (t=2).
    Coordinate: (J(2, -0.75))
  • Point (K): This point is on the midline as the graph goes upwards from a minimum to the next maximum. This occurs halfway between the minimum at (t=2) and the next maximum at (t=3).
    (t = \frac{2+3}{2} = 2.5).
    Coordinate: (K(2.5, 0))
  • Point (P): This is the next maximum peak. The period is (2) seconds (from (t=1) to (t=3)).
    Coordinate: (P(3, 0.75))

(B) Finding constants (a, b, c), and (d)

We are fitting the function (h(t) = a\sin(b(t+c)) + d).

  • Amplitude ((a)): Half the distance between max and min.
    (a = \frac{0.75 – (-0.75)}{2} = 0.75).
  • Vertical Shift ((d)): The average of max and min.
    (d = \frac{0.75 + (-0.75)}{2} = 0).
  • Period ((T)) and Frequency ((b)): The wiper completes a full cycle (left-right-left) in (2) seconds.
    (T = 2).
    The formula for period is (T = \frac{2\pi}{b}).
    (2 = \frac{2\pi}{b} \Rightarrow b = \pi).
  • Phase Shift ((c)):
    We know the function starts at a minimum at (t=0). A standard positive sine wave starts at 0 and goes up. A sine wave shifted to match this graph must cross the midline going upwards at (t=0.5) (halfway between min at (0) and max at (1)).
    So, we need the argument of the sine function, (b(t+c)), to be (0) when (t=0.5).
    (\pi(0.5 + c) = 0 \Rightarrow c = -0.5).
    Alternatively, using (c=1.5) is also valid, but (-0.5) is the simplest magnitude.

Values:
(a = 0.75)
(b = \pi)
(c = -0.5)
(d = 0)


(C) Analysis of interval ((t_1, t_2))

From part (A), (t_1) (point (G)) is (1.5) and (t_2) (point (J)) is (2). The interval is ((1.5, 2)).

(i) Which statement is true?
Looking at the graph between point (G) and point (J):
The graph is below the midline, meaning the values of (h) are negative.
The graph is moving downwards towards the minimum, meaning (h) is decreasing.
Answer: d. (h) is negative and decreasing.

(ii) Rate of change of (h)
The “rate of change of (h)” refers to the derivative, (h'(t)) (the slope of the tangent line).
On the interval ((1.5, 2)), the graph is concave up (it is shaped like a cup).
Mathematically:
– At (G) ((t=1.5)), the slope is at its steepest negative value.
– At (J) ((t=2)), the slope is zero (horizontal tangent at the minimum).
– As the slope goes from a negative number (e.g., (-2)) to (0), the value of the slope is increasing.

Answer: The rate of change of (h) is increasing on the interval ((t_1, t_2)).

Question 

The blades of an electric fan rotate in a clockwise direction and complete $5$ rotations every second. Point $B$ is on the tip of one of the fan blades and is located directly above the center of the fan at time $t = 0$ seconds. Point $B$ is $6$ inches from the center of the fan. The center of the fan is $20$ inches above a level table. The sinusoidal function $h$ models the distance between $B$ and the surface of the table in inches as a function of time $t$ in seconds.
(A) The graph of ℎ and its dashed midline for two full cycles is shown. Five points, 𝐹, 𝐺, 𝐽, 𝐾, and 𝑃 are labeled on the graph. No scale is indicated, and no axes are presented. 
Determine the possible coordinates $(t, h(t))$ for the $5$ points: $F, G, J, K,$ and $P$.
(B) The function $h$ can be written in the form $h(t) = a \sin(b(t + c)) + d$. Find values of constants $a, b, c,$ and $d$.
(C) Refer to the graph of $h$ in part (A). The $t$-coordinate of $K$ is $t_1$, and the $t$-coordinate of $P$ is $t_2$.
(i) On the interval $(t_1, t_2)$, which of the following is true about $h$?
      (A) $h$ is positive and increasing
     (B) $h$ is positive and decreasing
     (C) $h$ is negative and increasing
     (D) $h$ is negative and decreasing
(ii) Describe how the rate of change of $h$ is changing on the interval $(t_1, t_2)$.
▶️ Answer/Explanation
Detailed solution

(A)

The center of the fan is $d = 20$ inches above the table. The radius of the fan blade is $r = 6$ inches, which is the amplitude $a$. The maximum height is $20 + 6 = 26$ inches and the minimum height is $20 – 6 = 14$ inches. The fan completes $5$ rotations per second, so the period is $T = \frac{1}{5} = 0.2$ seconds. Point $B$ starts at the maximum height at $t = 0$, so point $F$ is $(0, 26)$. Point $G$ is at the midline after $\frac{1}{4}$ of a period: $(\frac{0.2}{4}, 20) = (0.05, 20)$. Point $J$ is at the minimum after $\frac{1}{2}$ of a period: $(\frac{0.2}{2}, 14) = (0.1, 14)$. Point $K$ is at the midline after $\frac{3}{4}$ of a period: $(\frac{3 \times 0.2}{4}, 20) = (0.15, 20)$. Point $P$ is at the maximum after $1$ full period: $(0.2, 26)$. The coordinates are: $F(0, 26)$, $G(0.05, 20)$, $J(0.1, 14)$, $K(0.15, 20)$, and $P(0.2, 26)$.

(B)

The amplitude is $a = 6$. The vertical shift (midline) is $d = 20$. The period is $T = 0.2$, so the frequency constant is $b = \frac{2\pi}{0.2} = 10\pi$. Since the function starts at a maximum at $t=0$, it follows $h(t) = 6 \cos(10\pi t) + 20$. To write this as a sine function $h(t) = 6 \sin(10\pi(t + c)) + 20$, we use the identity $\cos(\theta) = \sin(\theta + \frac{\pi}{2})$. Setting $10\pi(t + c) = 10\pi t + \frac{\pi}{2}$, we find $10\pi c = \frac{\pi}{2}$, which gives $c = \frac{1}{20} = 0.05$. Thus, $a = 6$, $b = 10\pi$, $c = 0.05$, and $d = 20$.

(C)

(i) On the interval $(t_1, t_2)$, which is $(0.15, 0.2)$, the graph moves from the midline (point $K$) up to the maximum (point $P$). Throughout this interval, $h(t)$ is between $20$ and $26$, so it is positive. The function is moving upwards, so it is increasing. The correct option is (A) $h$ is positive and increasing.
(ii) On the interval $(t_1, t_2)$, the graph is concave down as it levels off toward the maximum. The slope (rate of change) is positive because the function is increasing. However, the slope is becoming less steep as it approaches the horizontal tangent at point $P$. Therefore, the rate of change of $h$ is decreasing on the interval $(t_1, t_2)$.

Scroll to Top