▶️ Answer/Explanation
From the graphs (described in the original question):
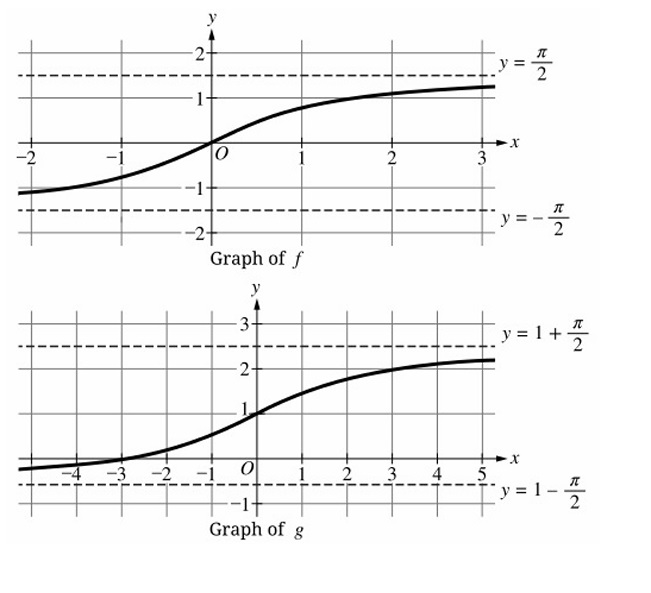
– \( g(x) \) appears horizontally wider than \( f(x) = \tan^{-1}x \), indicating a horizontal stretch (dilation) by a factor of 2, which corresponds to replacing \( x \) with \( \frac{x}{2} \).
– \( g(x) \) is also shifted upward by 1 unit compared to the stretched curve.
Thus, \( g(x) = \tan^{-1}\left(\frac{x}{2}\right) + 1 \).
✅ Answer: (C)
▶️ Answer/Explanation
From the graph:
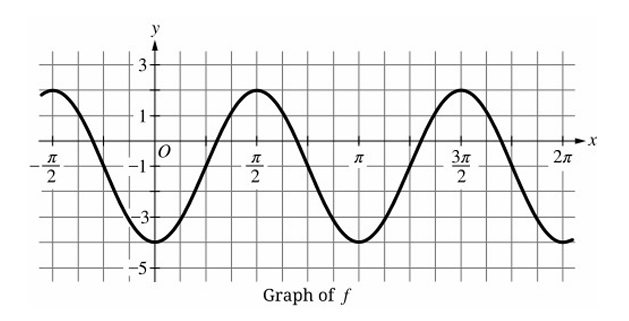
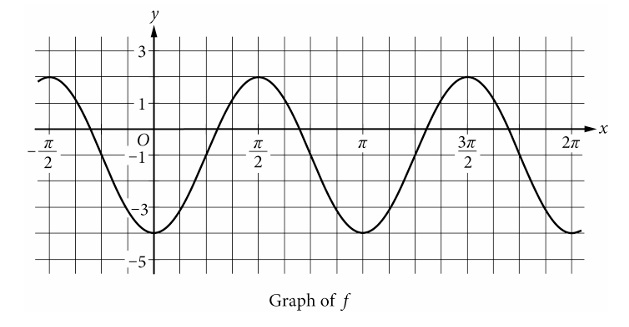
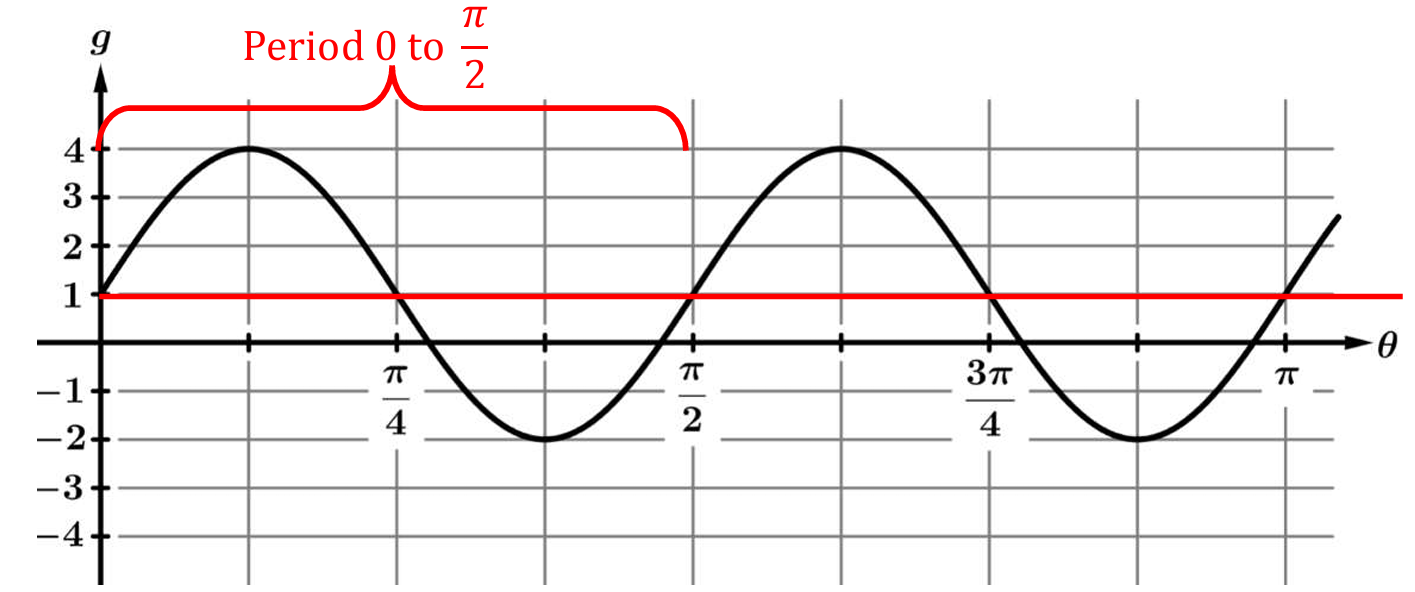
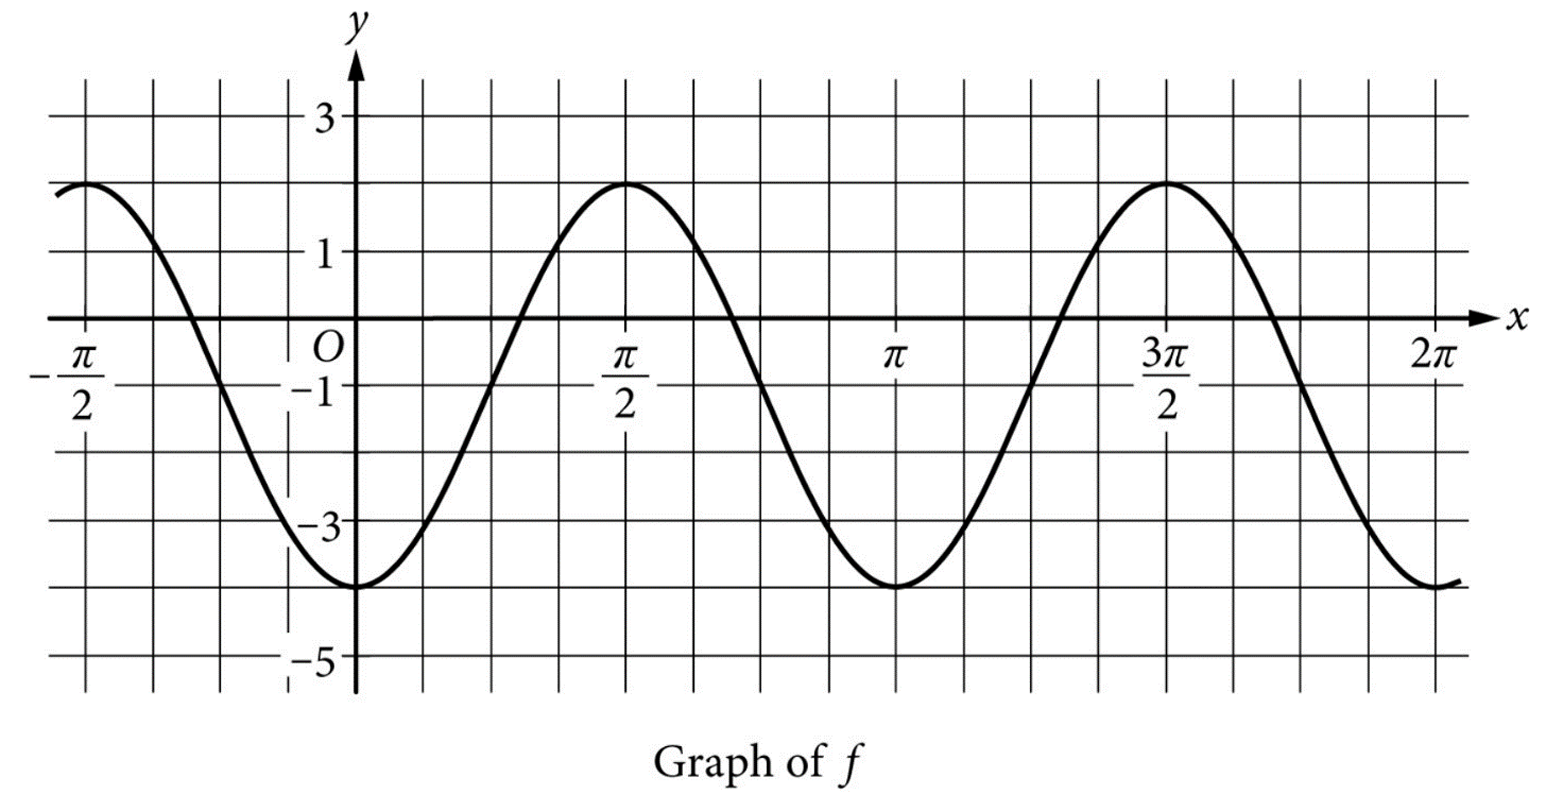
– Max = 2, Min = -4 → Amplitude = \( \frac{2 – (-4)}{2} = 3 \)
– Midline: \( y = \frac{2 + (-4)}{2} = -1 \)
– Period: distance between consecutive peaks (or troughs) = \( \pi \) → \( b = \frac{2\pi}{\pi} = 2 \)
– Shape matches a sine curve shifted right by \( \frac{\pi}{4} \) (since sine normally starts at midline going up at 0, here that occurs at \( x = \frac{\pi}{4} \))
Thus: \( f(x) = 3\sin(2(x – \frac{\pi}{4})) – 1 \).
✅ Answer: (C)
▶️ Answer/Explanation
\( g(x) = \frac{1}{f(x)} = \frac{1}{3\sec x} = \frac{1}{3} \cos x \).
Thus \( g \) is a cosine function with amplitude \( \frac13 \) and period \( 2\pi \).
However, \( f(x) = 3\sec x \) is undefined where \( \cos x = 0 \) (\( x = \frac{\pi}{2} + k\pi \)), so \( g \) will have holes at those \( x \)-values even though \( \cos x = 0 \) there, because \( \frac{1}{3\sec x} \) would involve division by infinity.
Graph (A) matches \( y = \frac13\cos x \) with holes at the vertical asymptotes of \( \sec x \).
✅ Answer: (A)
▶️ Answer/Explanation
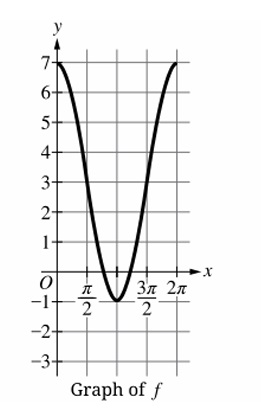
Amplitude \( A = \frac{7 – (-1)}{2} = 4 \).
Midline \( d = \frac{7 + (-1)}{2} = 3 \).
Since the graph has maxima at \( x = 0 \) and \( x = 2\pi \) and no horizontal shift, a cosine function (which has a maximum at \( x = 0 \)) fits best.
Thus \( f(x) = 4\cos x + 3 \) or equivalently \( 3 + 4\cos x \).
✅ Answer: (A)
▶️ Answer/Explanation
From the graph:
• Midline: \( y = -1 \) → vertical shift \( d = -1 \).
• Amplitude: max \(=2\), min \(=-4\), amplitude \(= \frac{2 – (-4)}{2} = 3\) → \( a = 3 \).
• Period: distance between consecutive maxima \( \frac{3\pi}{2} – \frac{\pi}{2} = \pi \) → \( \frac{2\pi}{b} = \pi \) ⇒ \( b = 2 \).
• Shape: starts increasing through midline at \( x = \frac{\pi}{4} \) (like sine shifted right \( \frac{\pi}{4} \)).
A sine function with phase shift \( \frac{\pi}{4} \) to the right:
\[ f(x) = 3\sin\left(2\left(x – \frac{\pi}{4}\right)\right) – 1 \]
This matches option (C).
✅ Answer: (C)
▶️ Answer/Explanation
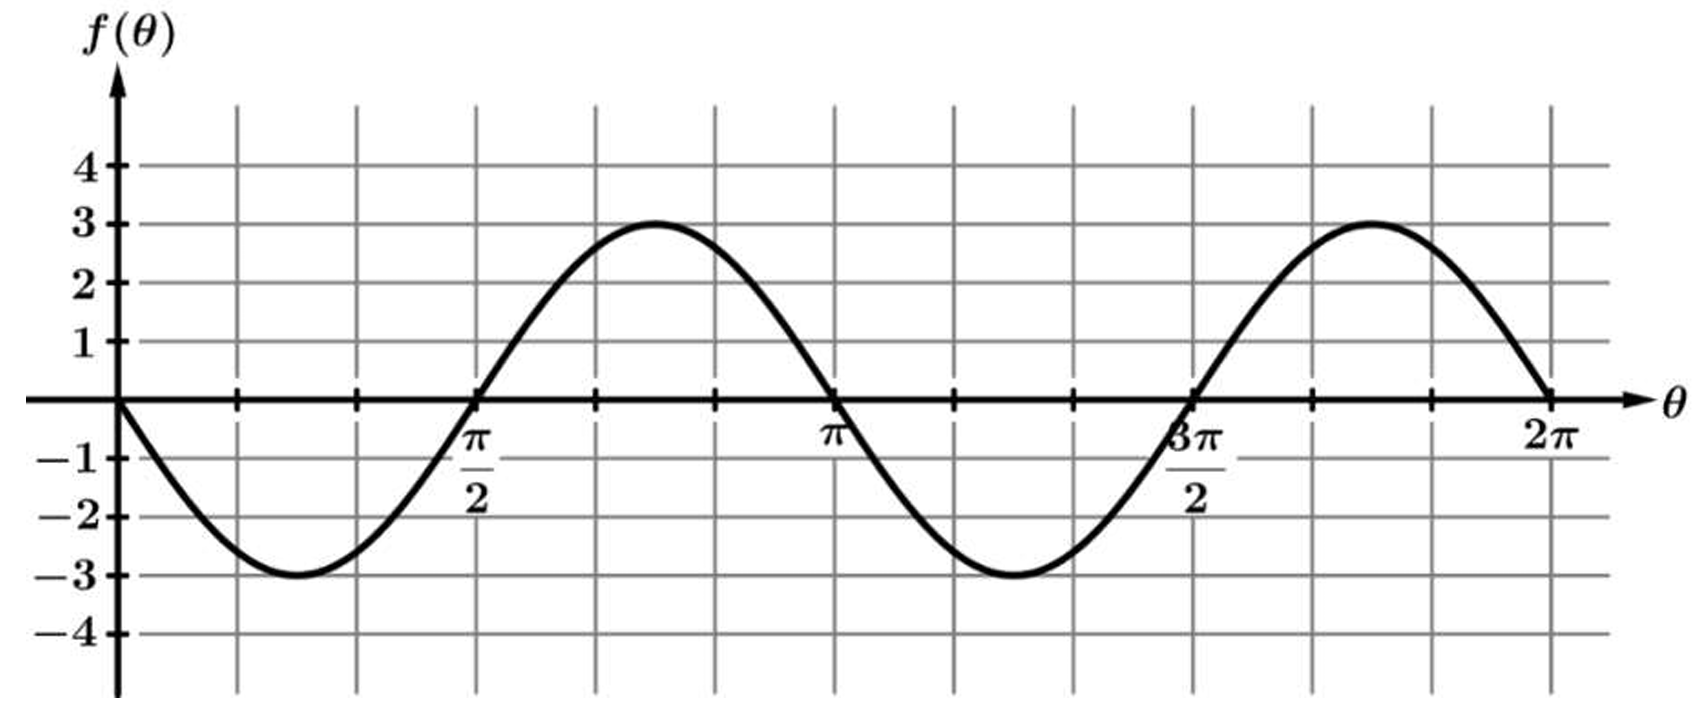
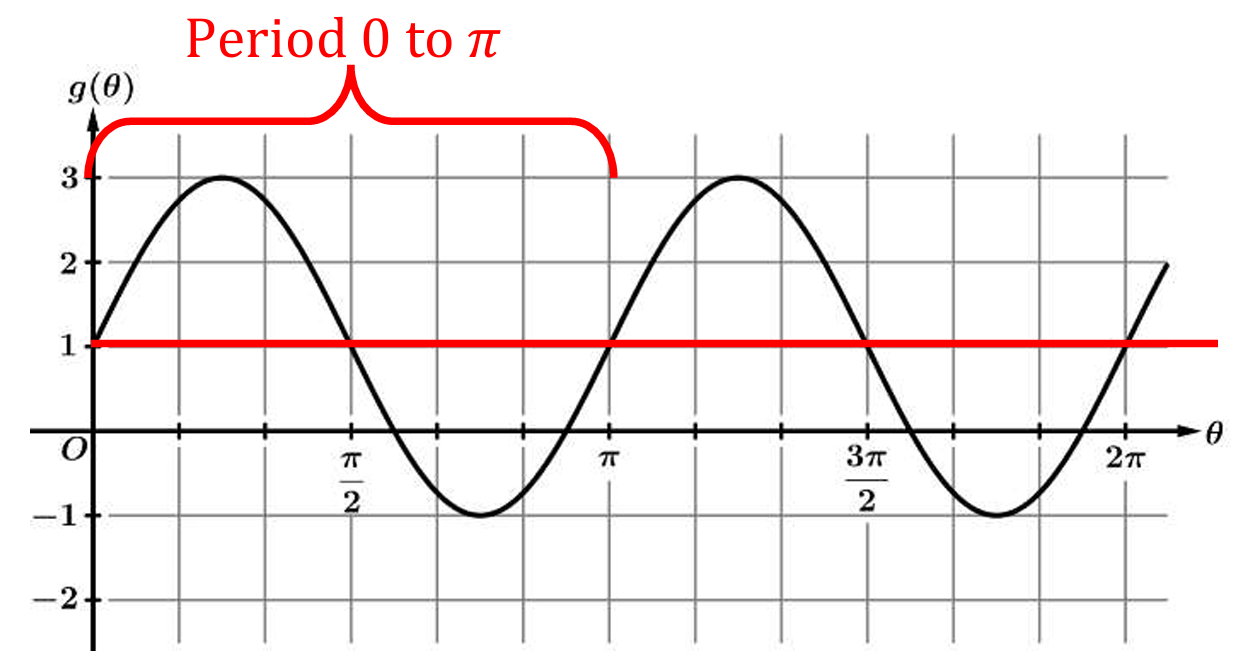
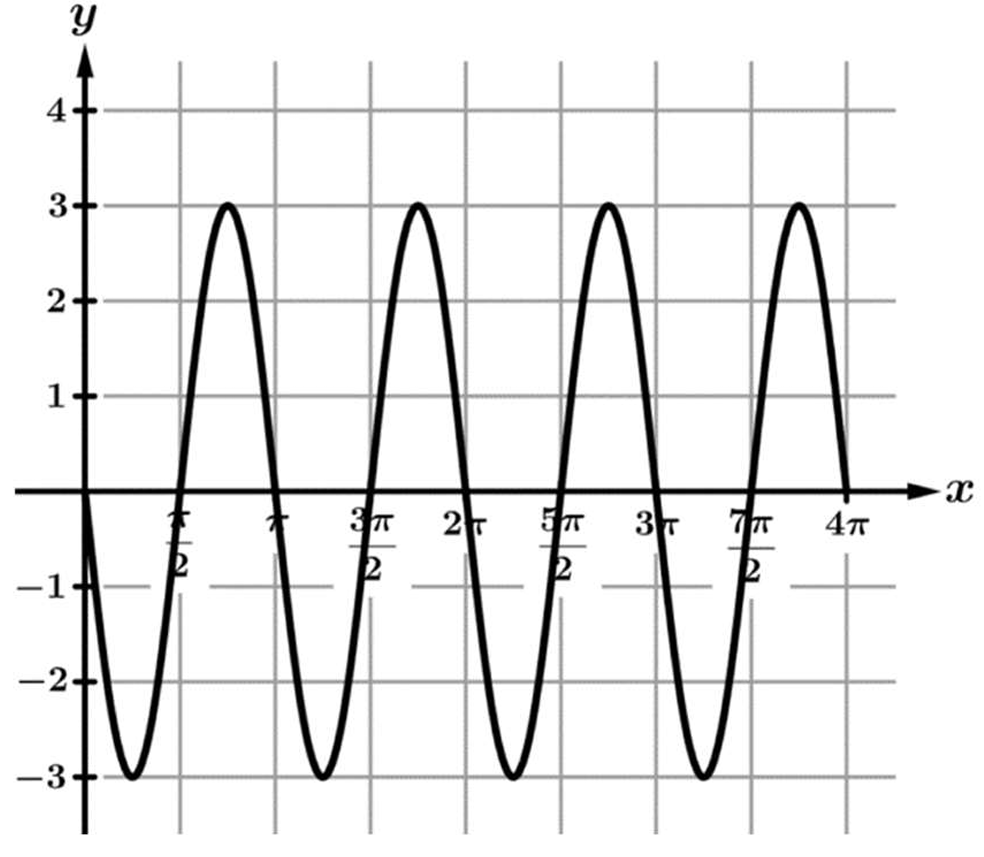
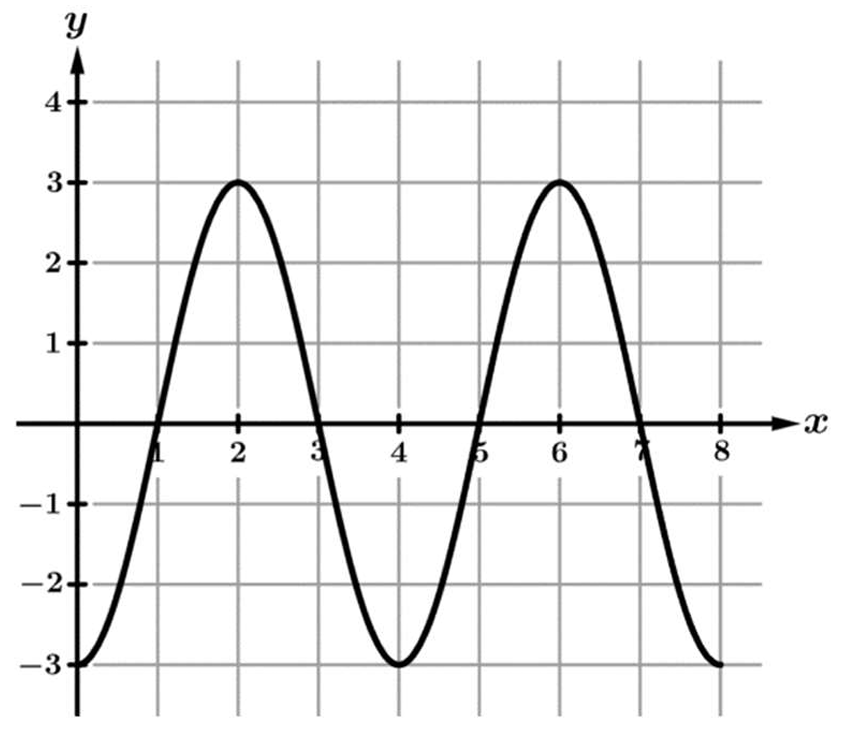
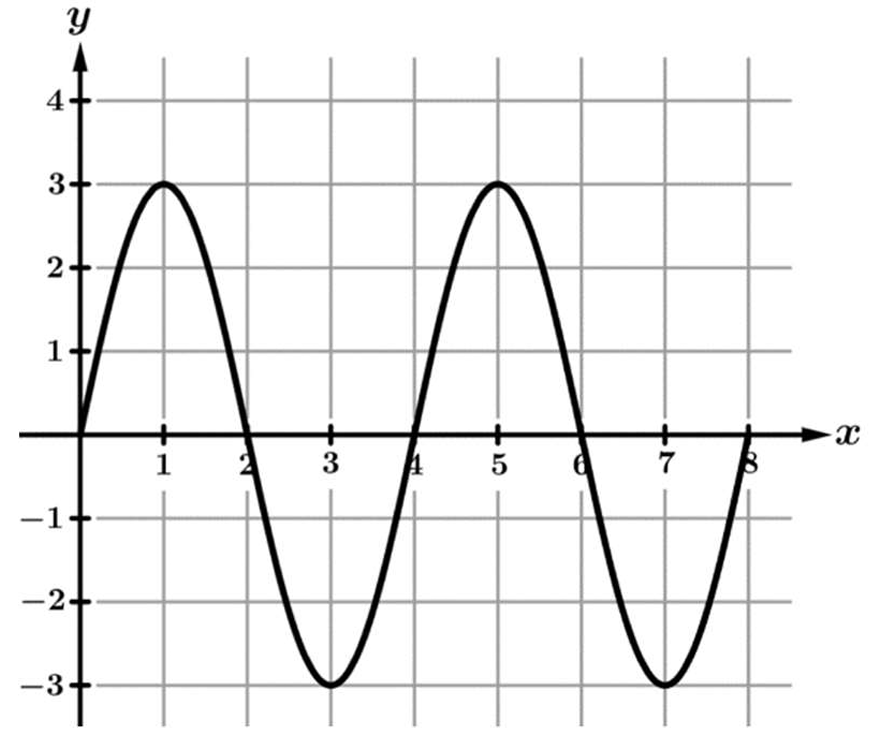
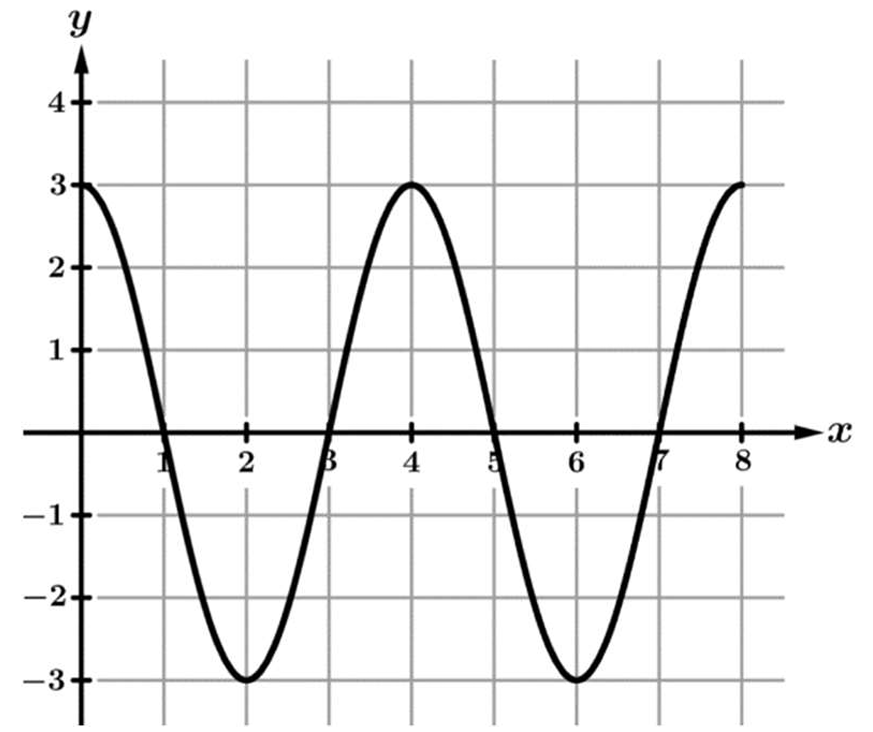
1. Find the Amplitude: The graph oscillates between a maximum value of \( 3 \) and a minimum value of \( -3 \). The amplitude is half of this range: \( \frac{3 – (-3)}{2} = 3 \).
2. Determine the Sign (Reflection): The standard sine graph \( \sin(x) \) starts at 0 and goes up. This graph starts at 0 and goes down, indicating a reflection over the x-axis. Therefore, the leading coefficient is negative, so \( a = -3 \).
3. Find the Period: The graph completes one full cycle (going down, then up, and back to 0) from \( x = 0 \) to \( x = \pi \). So, the period is \( \pi \).
4. Calculate the Frequency Coefficient (\( b \)): Using the formula \( \text{Period} = \frac{2\pi}{b} \), we substitute the period: \( \pi = \frac{2\pi}{b} \). Solving for \( b \) gives \( b = 2 \).
5. Conclusion: Combining these components (\( a = -3 \) and \( b = 2 \)), the expression is \( -3 \sin(2x) \). This matches option (C).
▶️ Answer/Explanation
The correct option is (D).
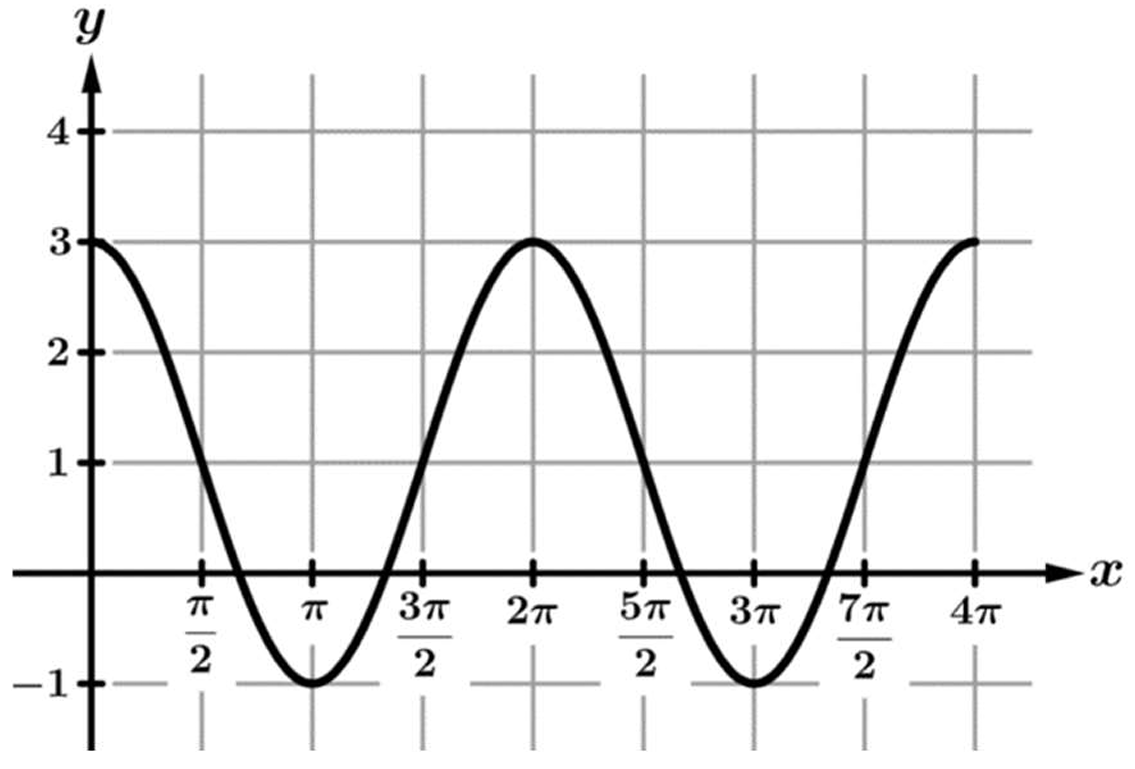
1. Determine Amplitude and Midline: The maximum value is \(3\) and the minimum is \(-1\). The midline is \(y = \frac{3 + (-1)}{2} = 1\), and the amplitude is \(\frac{3 – (-1)}{2} = 2\). All options reflect this.
2. Determine Period: The graph completes one full cycle from \(x=0\) to \(x=\pi\). Therefore, the period is \(\pi\).
3. Find Frequency Coefficient (\(b\)): Using the formula \(\text{Period} = \frac{2\pi}{b}\), we get \(\pi = \frac{2\pi}{b}\), which implies \(b = 2\). This eliminates option (A) because it has \(b=\pi\).
4. Test Points: At \(x=0\), the graph is at its maximum \(y=3\). We substitute \(x=0\) into the remaining options:
5. Option (B): \(2 \cos(2(0 – \frac{\pi}{2})) + 1 = 2 \cos(-\pi) + 1 = -1\) (Incorrect).
6. Option (C): \(-2 \cos(2(0 – \pi)) + 1 = -2 \cos(-2\pi) + 1 = -1\) (Incorrect).
7. Option (D): \(-2 \cos(2(0 – \frac{3\pi}{2})) + 1 = -2 \cos(-3\pi) + 1 = -2(-1) + 1 = 3\) (Correct).
▶️ Answer/Explanation
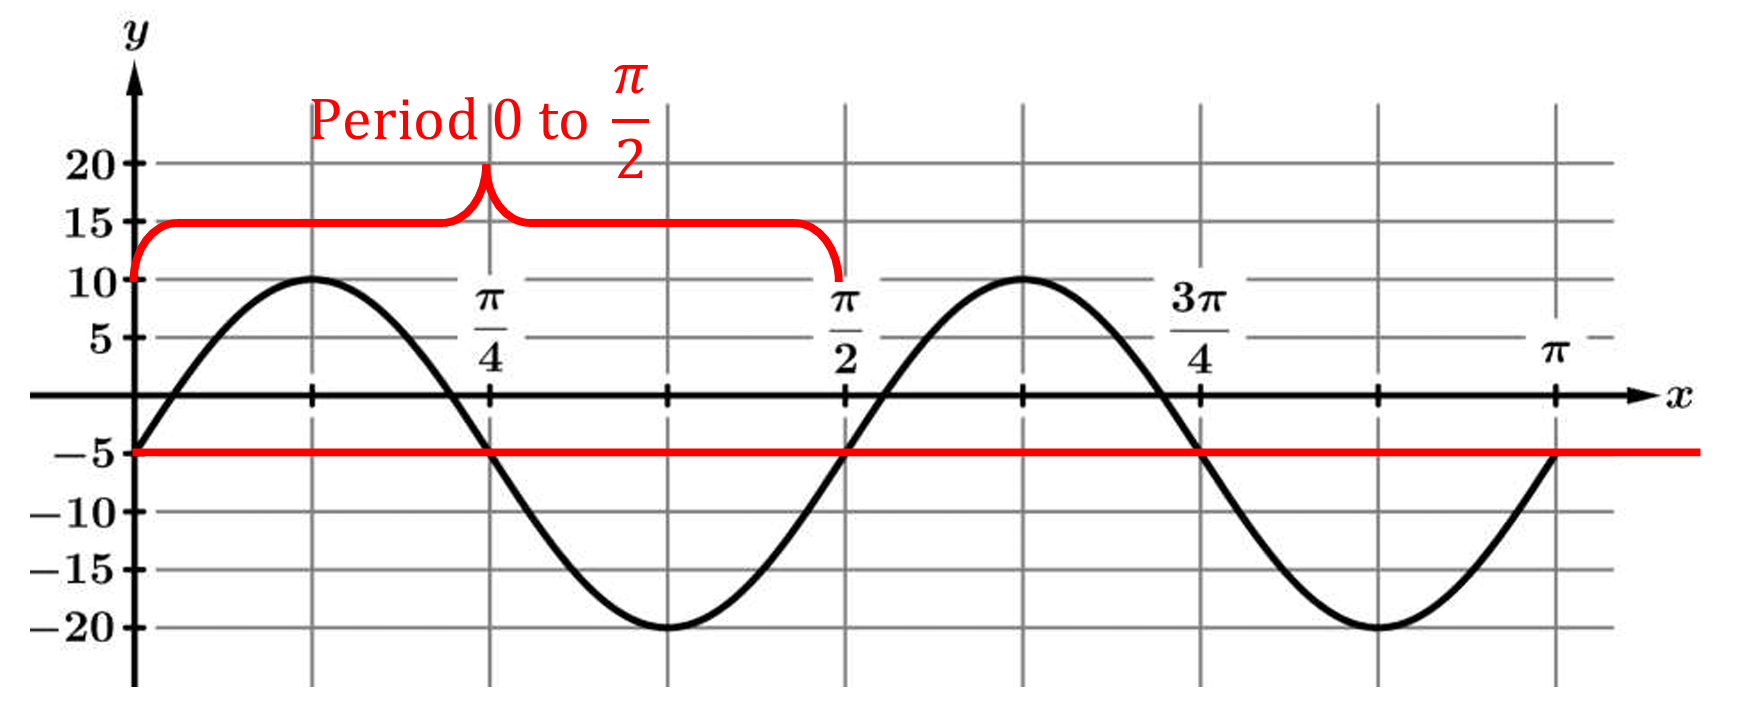
The amplitude is half the distance between the max and min: \( \frac{10 – (-20)}{2} = 15 \).
The midline is the average of the max and min: \( y = \frac{10 + (-20)}{2} = -5 \).
The graph completes one full cycle from \( x=0 \) to \( x=\frac{\pi}{2} \), so the period is \( \frac{\pi}{2} \).
Using \( \text{Period} = \frac{2\pi}{b} \), we find \( b = \frac{2\pi}{\pi/2} = 4 \). This eliminates option (A).
To identify the correct phase shift, test the maximum point at \( x = \frac{\pi}{8} \).
Substitute \( x = \frac{\pi}{8} \) into option (B): \( -15\sin\left(4\left(\frac{\pi}{8} – \frac{\pi}{4}\right)\right) – 5 = -15\sin\left(-\frac{\pi}{2}\right) – 5 \).
Since \( \sin\left(-\frac{\pi}{2}\right) = -1 \), this yields \( -15(-1) – 5 = 10 \), which matches the graph.
Therefore, option (B) is the correct expression.
▶️ Answer/Explanation
▶️ Answer/Explanation
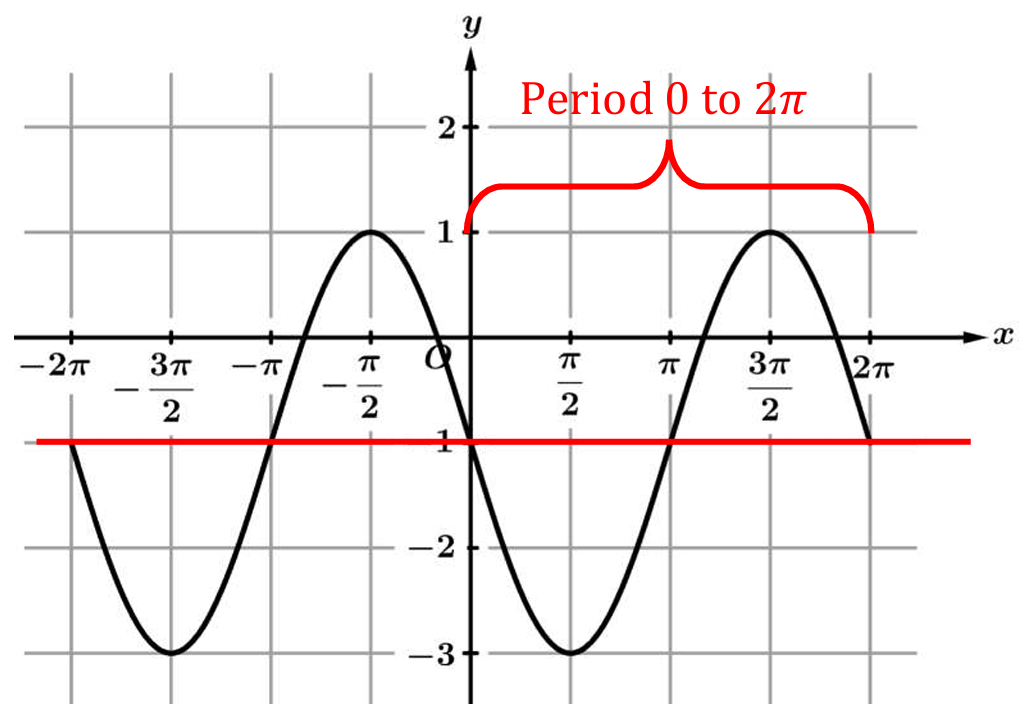
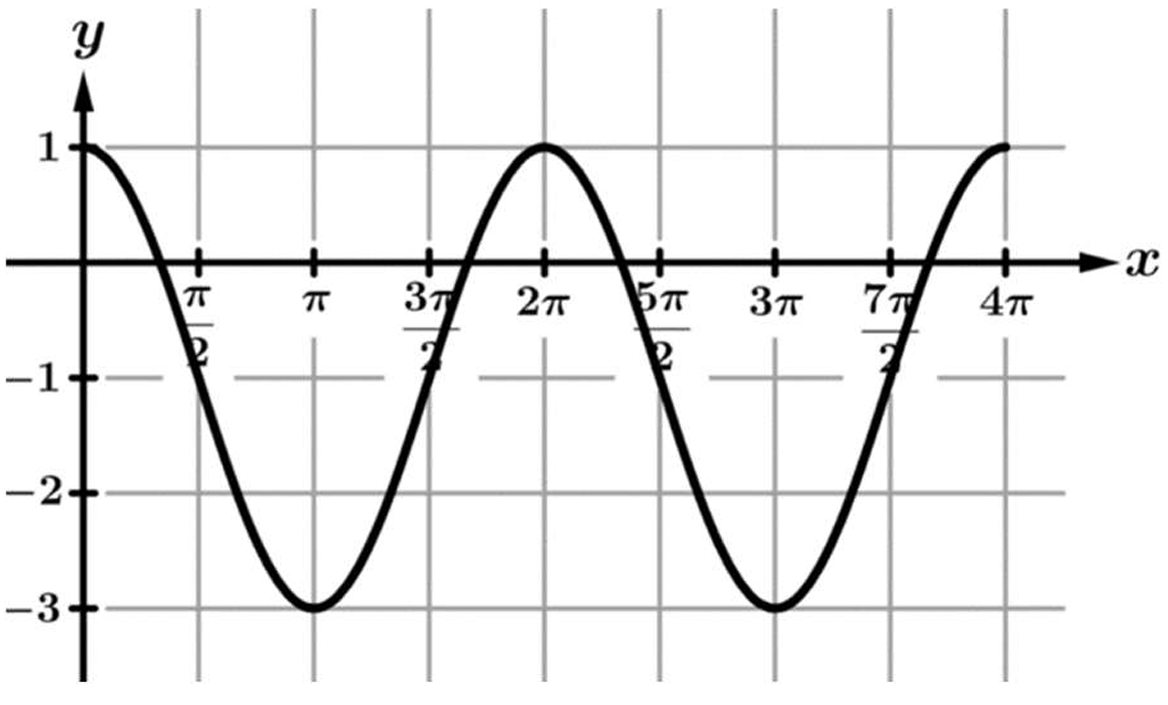
The maximum value of the graph is \( 1 \) and the minimum is \( -3 \), so the midline is \( y = \frac{1 + (-3)}{2} = -1 \).
The amplitude is half the distance between the maximum and minimum: \( \frac{1 – (-3)}{2} = 2 \).
The graph completes one full cycle from \( x=0 \) to \( x=2\pi \), so the period is \( 2\pi \).
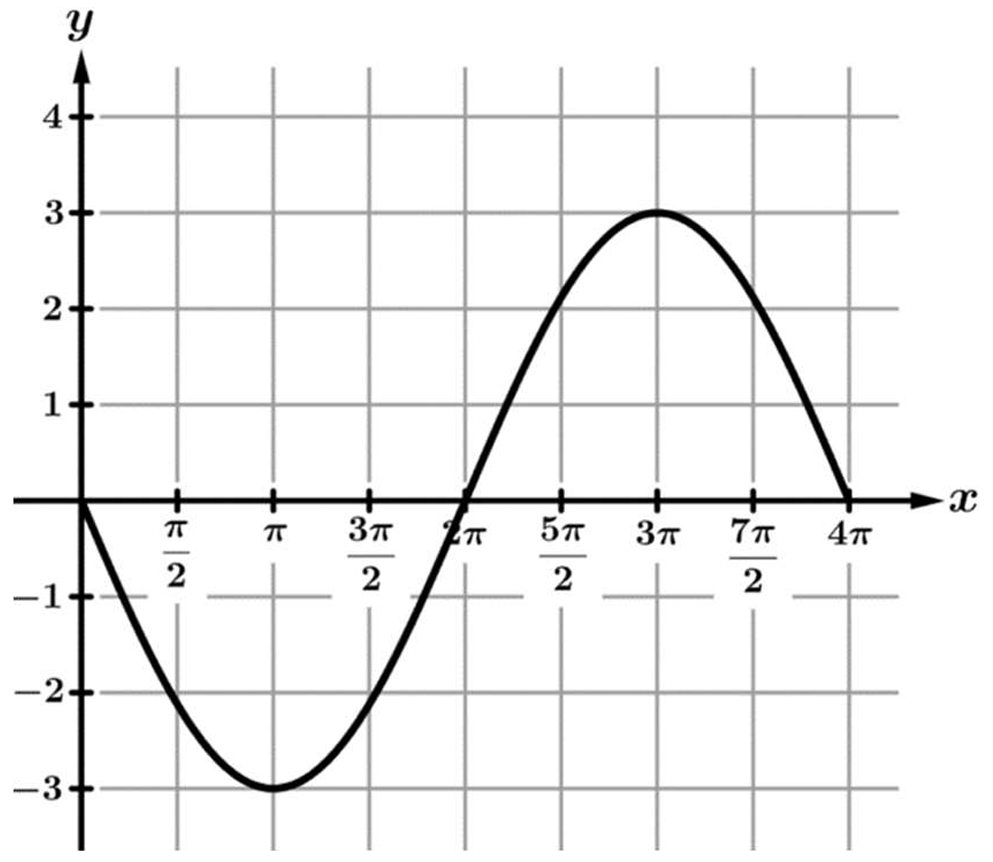
At \( x=0 \), the graph starts at the midline and goes downwards, which indicates a reflected sine function: \( y = -2\sin(x) – 1 \).
Looking at option (D), \( -2\sin(x + 2\pi) – 1 \) is equivalent to \( -2\sin(x) – 1 \) because the sine function has a period of \( 2\pi \).
Therefore, option (D) is the correct expression for the function \( k(x) \).
▶️ Answer/Explanation
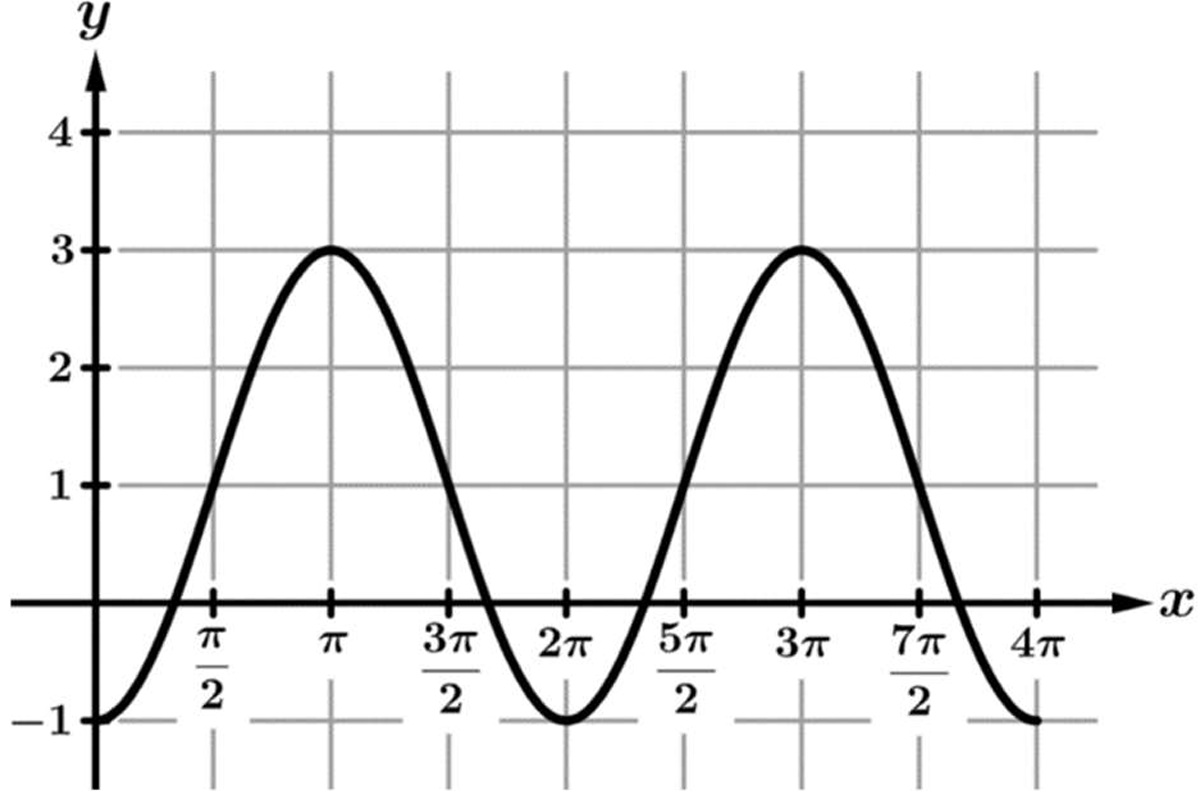
The Midline is the average of the maximum and minimum values: \(y = \frac{3 + (-1)}{2} = 1\), so the vertical shift is \(+1\).
The Amplitude is half the distance between the max and min: \(\frac{3 – (-1)}{2} = 2\).
The Period is the length of one full cycle, which is clearly \(\pi\). The frequency coefficient is \(b = \frac{2\pi}{\text{Period}} = \frac{2\pi}{\pi} = 2\).
The graph starts at the midline \((0, 1)\) and goes up, which corresponds to a standard sine function: \(y = 2\sin(2x) + 1\).
To match option (A), we verify using the identity \(\sin(\theta – 3\pi) = -\sin(\theta)\).
Expanding option (A): \(-2\sin(2x – 3\pi) + 1 = -2(-\sin(2x)) + 1 = 2\sin(2x) + 1\).
Therefore, option (A) is the correct expression equivalent to the graph.
▶️ Answer/Explanation
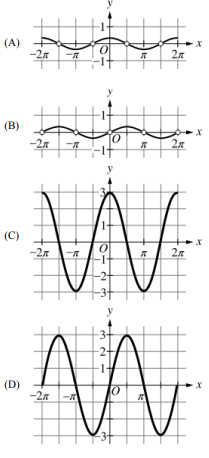
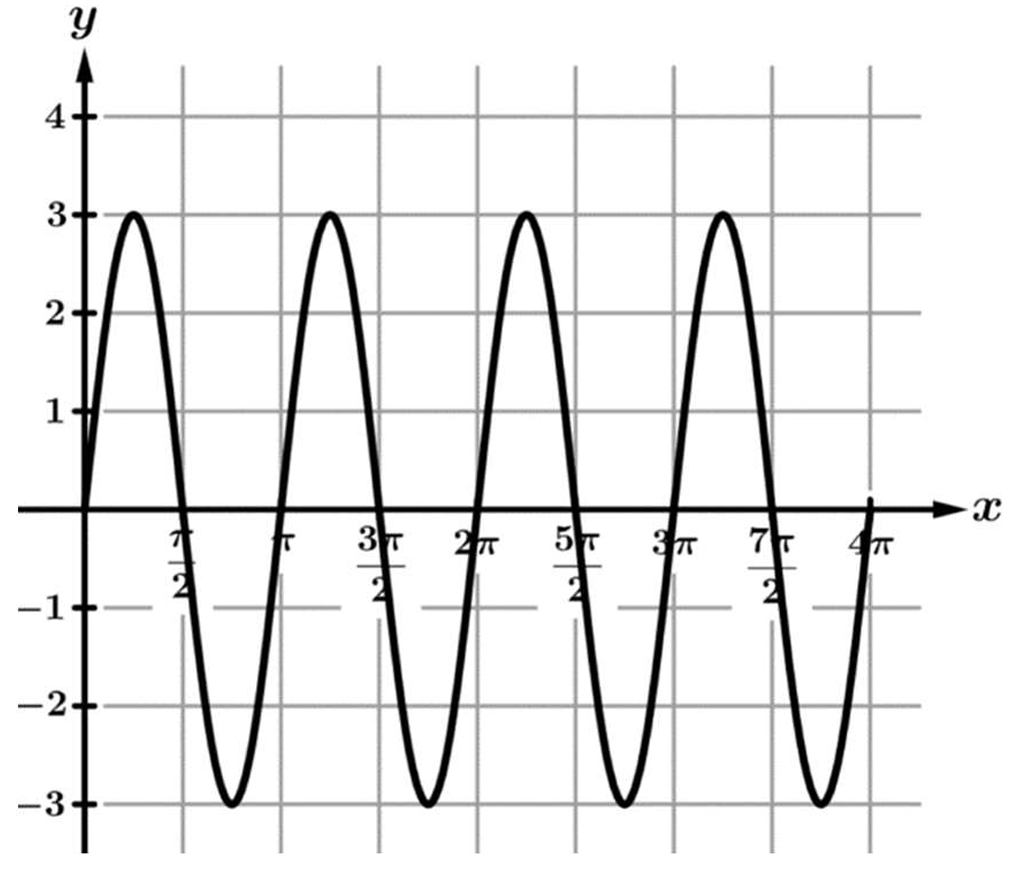
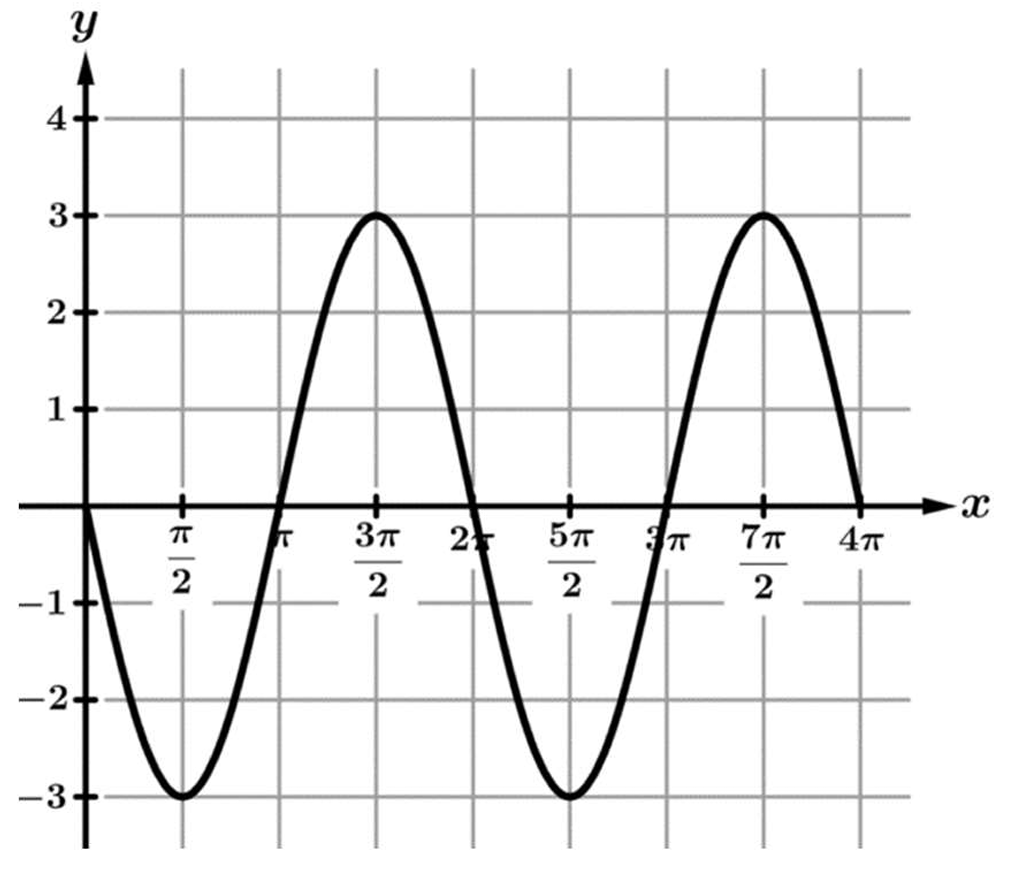
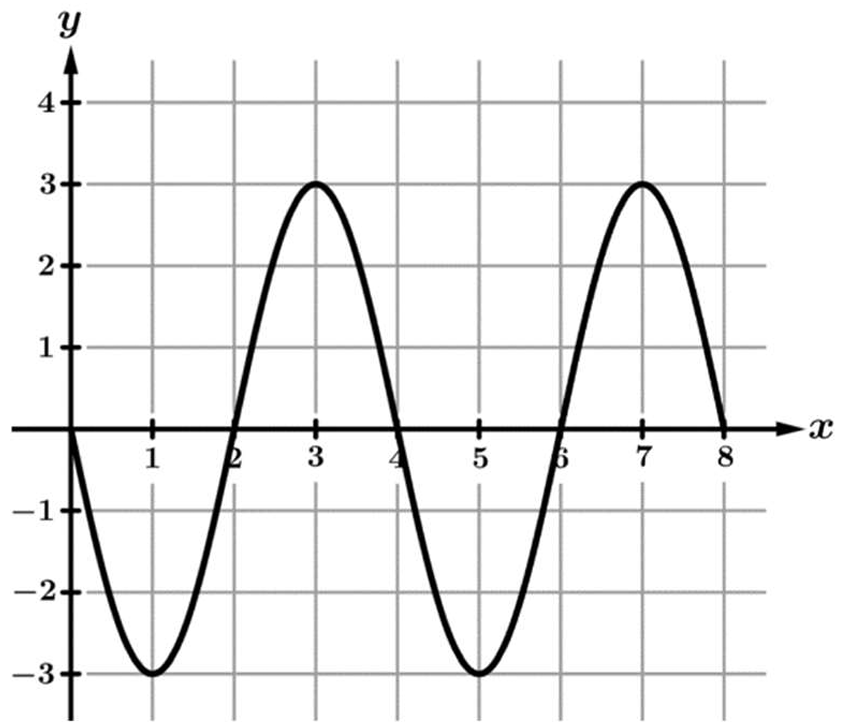
The function is given by \( f(x) = -3\sin(2x) \).
The amplitude is \( |-3| = 3 \), so the graph ranges between -3 and 3.
The coefficient \( b = 2 \) determines the period: \( \text{Period} = \frac{2\pi}{b} = \frac{2\pi}{2} = \pi \).
The negative sign (\( -3 \)) indicates a reflection across the x-axis, so the graph must start at 0 and go downwards.
Graphs (C) and (D) are incorrect because they display periods of \( 2\pi \) and \( 4\pi \) respectively.
Graph (A) is incorrect because it starts by going upwards (positive sine).
Graph (B) correctly shows a period of \( \pi \) and reflects across the x-axis (starts downwards).
Therefore, the correct option is (B).
▶️ Answer/Explanation
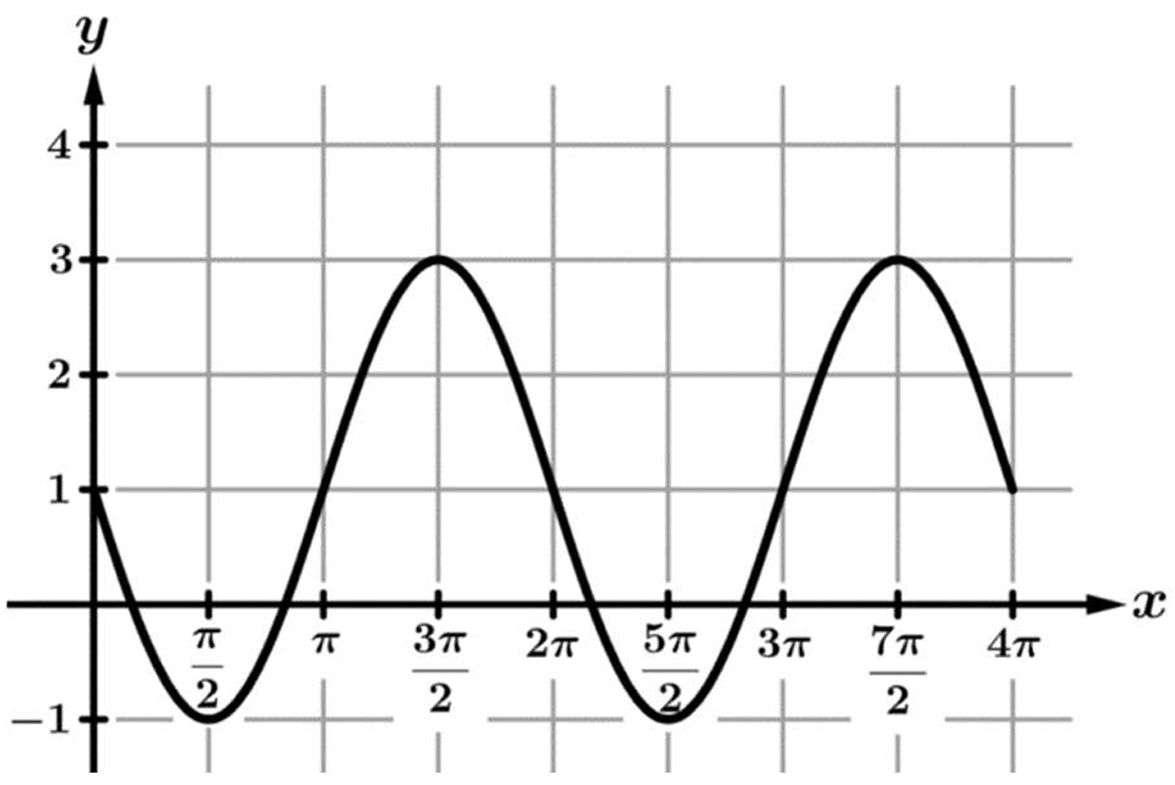
The function is \( f(x) = 1 – 2\cos(x) \). The constant term is \( 1 \), so the midline is \( y = 1 \). This eliminates option (D) which has a midline of \( y = -1 \).
The period is determined by \( \frac{2\pi}{1} = 2\pi \). Option (A) displays a period of \( 4\pi \), so it is incorrect.
The coefficient of the cosine term is \( -2 \). The negative sign indicates a reflection over the midline, meaning the graph starts at a minimum.
Evaluating at \( x = 0 \), we get \( f(0) = 1 – 2\cos(0) = 1 – 2(1) = -1 \). The graph must start at \( (0, -1) \).
Option (B) starts at a maximum value of \( y = 3 \), so it is incorrect.
Option (C) correctly starts at \( y = -1 \), oscillates with a period of \( 2\pi \), and has the correct midline of \( y = 1 \).
Therefore, the correct graph is (C).
▶️ Answer/Explanation
The correct choice is (B).
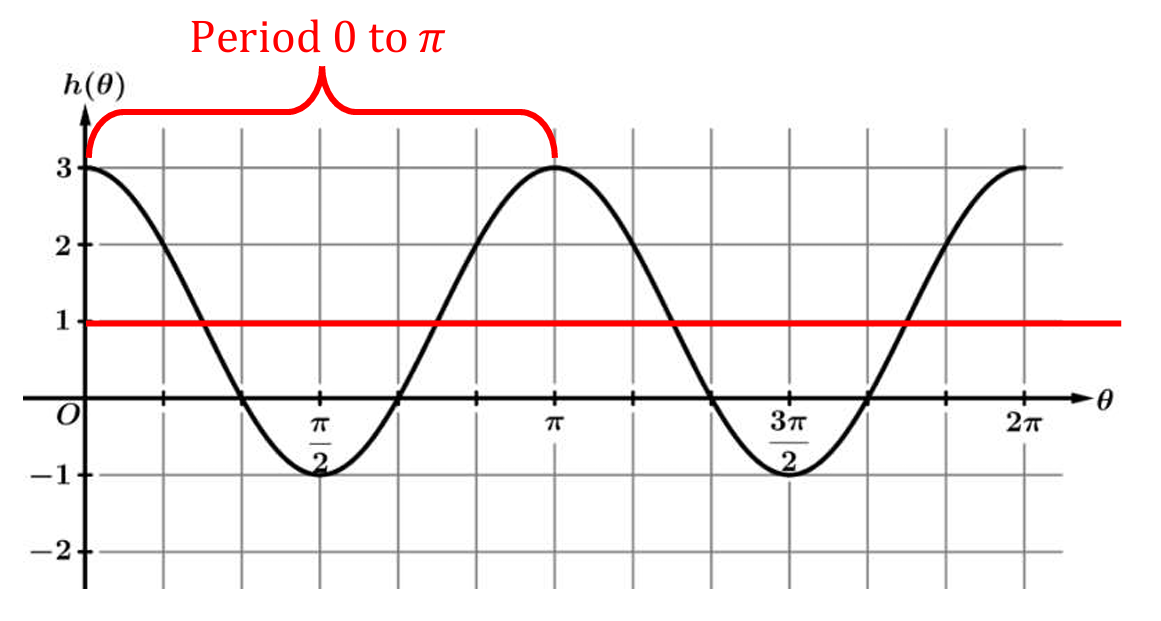
1. Calculate Period: Using \( b = \frac{\pi}{2} \), the period is \( \frac{2\pi}{b} = \frac{2\pi}{\pi/2} = 4 \). All options show a period of 4.
2. Identify Function Type: Graphs (A) and (C) start at \( y=0 \), which indicates sine curves. The given function is a cosine curve.
3. Check y-intercept: Evaluate \( h(x) \) at \( x=0 \). \( h(0) = -3 \cos(0) = -3(1) = -3 \). The graph must start at -3.
4. Analyze Reflection: The negative coefficient (\(-3\)) reflects the cosine graph over the line \( y=0 \) (x-axis), meaning it starts at a minimum rather than a maximum.
5. Conclusion: Graph (D) is a standard positive cosine curve (starts at 3), while Graph (B) correctly starts at -3.
▶️ Answer/Explanation
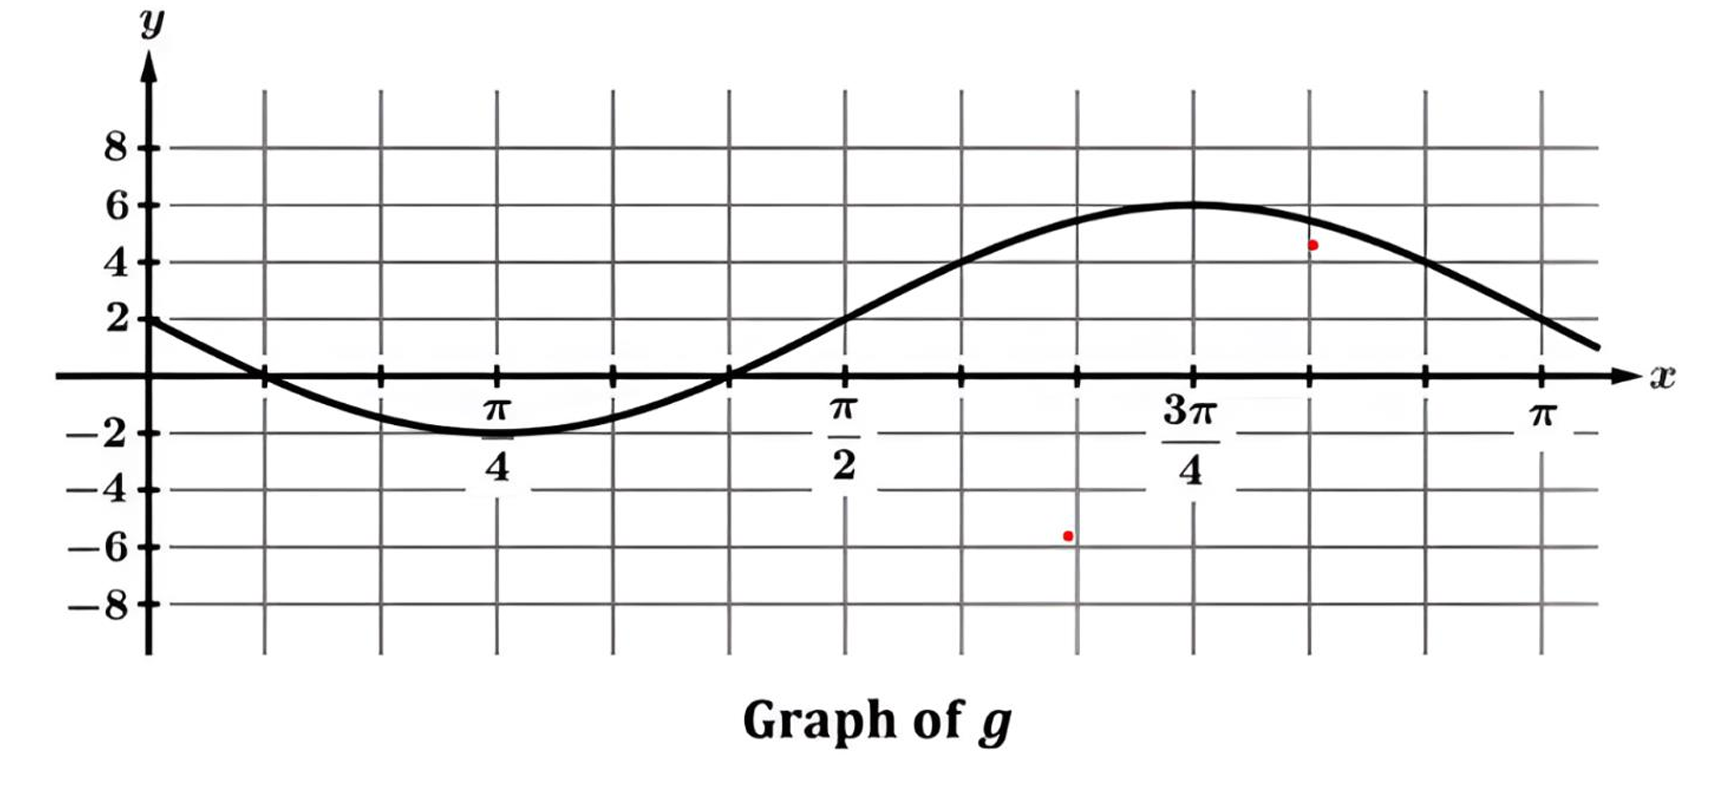
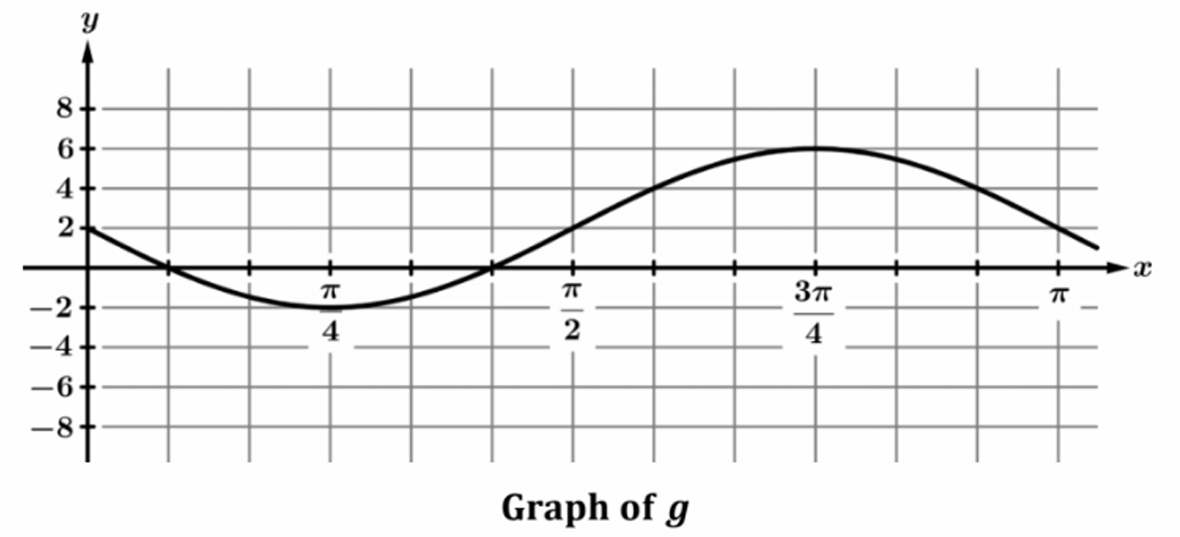
Analyze the graph to determine the parameters for the general form \( g(x) = A \cos(b(x – h)) + k \):
- Midline (\( k \)): The vertical center between the max (\( 6 \)) and min (\( -2 \)) is \( \frac{6 + (-2)}{2} = 2 \).
- Amplitude (\( A \)): The distance from the midline to a peak is \( 6 – 2 = 4 \).
- Period and Frequency (\( b \)): The distance from the minimum (\( \frac{\pi}{4} \)) to the maximum (\( \frac{3\pi}{4} \)) is half the period (\( \frac{\pi}{2} \)). Thus, the full period is \( \pi \), making \( b = \frac{2\pi}{\pi} = 2 \).
- Phase Shift (\( h \)): A positive cosine graph peaks at its phase shift. The graph shows a maximum at \( x = \frac{3\pi}{4} \).
Substituting these values gives: \( g(x) = 4 \cos\left(2\left(x – \frac{3\pi}{4}\right)\right) + 2 \).
This corresponds to Option (D).
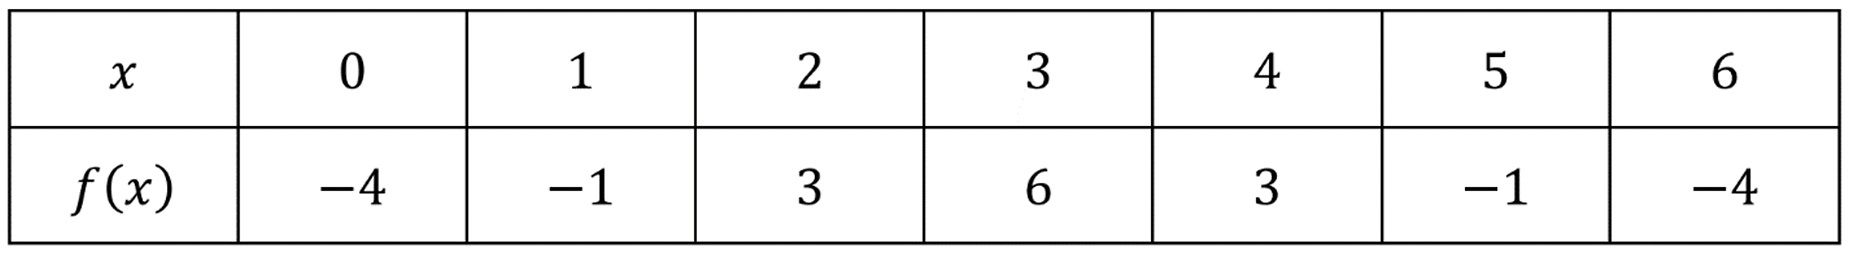
▶️ Answer/Explanation
The midline is the average of the maximum (\(6\)) and minimum (\(-4\)) values: \(\frac{6 + (-4)}{2} = 1\).
The amplitude is the difference between the maximum value and the midline: \(6 – 1 = 5\).
The period is given as \(6\). Using the formula \(\text{Period} = \frac{2\pi}{b}\), we get \(6 = \frac{2\pi}{b}\), solving for \(b\) gives \(b = \frac{\pi}{3}\).
At \(x = 0\), the function value is the minimum (\(-4\)), which indicates a reflected cosine function (negative coefficient).
Therefore, the function is modeled by \(f(x) = -5 \cos\left(\frac{\pi}{3}x\right) + 1\).
Comparing this with the given options, it matches option (D).
▶️ Answer/Explanation
Correct Option: (D)
The midline is (y = -1) because the maximum is (2) and the minimum is (-4), averaging to (\frac{2 + (-4)}{2} = -1).
The amplitude is (3), calculated as the distance from the midline (-1) to the maximum (2).
The period is (\pi), as the distance between peaks (e.g., from (\approx 0.375\pi) to (\approx 1.375\pi)) corresponds to (\pi). This implies the coefficient (B = \frac{2\pi}{\pi} = 2).
The graph crosses the midline (y=-1) going upwards at (x = \frac{\pi}{8}). Since a standard sine function starts this way at (x=0), this indicates a phase shift of (\frac{\pi}{8}) to the right.
Combining these, the function is (f(x) = 3 \sin\left(2\left(x – \frac{\pi}{8}\right)\right) – 1).
▶️ Answer/Explanation
The midline of the graph is $y = 2$ and the amplitude is $4$, so the form is $g(x) = 4f(b(x-h)) + 2$.
The period is $\pi$ (from $x = -\frac{\pi}{4}$ to $x = \frac{3\pi}{4}$), so $b = \frac{2\pi}{\text{period}} = \frac{2\pi}{\pi} = 2$.
A maximum occurs at $x = \frac{3\pi}{4}$, which matches the peak of a standard cosine function shifted right.
Substituting into the cosine form $A \cos(b(x-h)) + k$, we get $4 \cos(2(x – \frac{3\pi}{4})) + 2$.
Checking point $(0, 2)$: $4 \cos(2(0 – \frac{3\pi}{4})) + 2 = 4 \cos(-\frac{3\pi}{2}) + 2 = 4(0) + 2 = 2$, which is correct.
Therefore, the expression in option (D) correctly represents the graph.