Determining Period and Frequency from a Graph
For a sinusoidal function, the period can be determined by identifying how often the graph repeats its maximum or minimum values.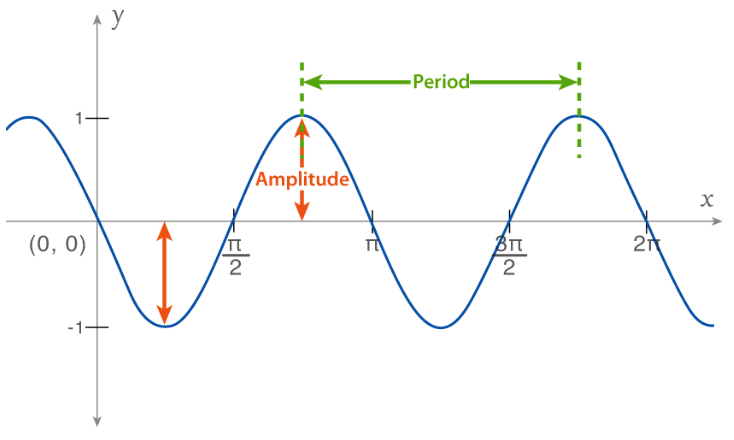
Specifically, the smallest interval of input values between:
two consecutive maxima, or
two consecutive minima
is equal to the period of the sinusoidal function.
Once the period is known, the frequency can be found using the reciprocal relationship:
\( \text{Frequency} = \dfrac{1}{\text{Period}} \)
This method is especially useful when working with graphs or real-world sinusoidal models, where an explicit formula may not be given.
Example:
A sinusoidal graph has a maximum at \( x = 1 \) and the next maximum at \( x = 7 \). Determine the period and frequency.
▶️ Answer/Explanation
Find the period
The period is the distance between consecutive maxima:
\( \text{Period} = 7 – 1 = 6 \)
Find the frequency
\( \text{Frequency} = \dfrac{1}{6} \)
Final answer: Period = 6, Frequency = \( \dfrac{1}{6} \).
Example:
A sinusoidal model of ocean tides has consecutive minimum water levels at \( t = 4 \) hours and \( t = 16 \) hours. Determine the period and frequency of the model.
▶️ Answer/Explanation
Find the period
The time between consecutive minima is:
\( 16 – 4 = 12 \)
So, the period is 12 hours.
Find the frequency
\( \text{Frequency} = \dfrac{1}{12} \)
Final answer: Period = 12 hours, Frequency = \( \dfrac{1}{12} \) cycles per hour.
Using Maximum and Minimum Values to Determine Amplitude and Vertical Shift
For a sinusoidal function model, the maximum and minimum output values provide direct information about the amplitude and vertical shift of the graph.
Amplitude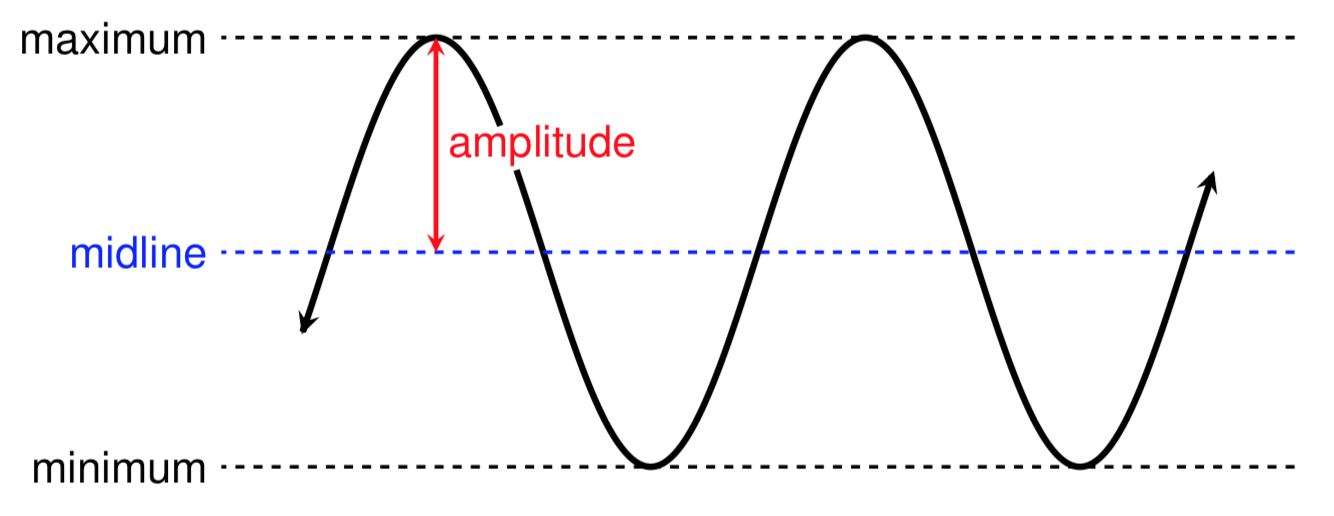
The amplitude is half the distance between the maximum and minimum values of the function.
\( \text{Amplitude} = \dfrac{\text{maximum value} – \text{minimum value}}{2} \)
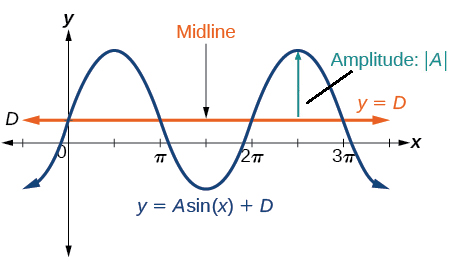
Vertical Shift (Midline)
The vertical shift is given by the average of the maximum and minimum values. This average determines the equation of the midline.
\( \text{Midline} = \dfrac{\text{maximum value} + \text{minimum value}}{2} \)
If the midline is \( y = d \), then the graph is shifted vertically by \( d \) units from \( y = 0 \).
These relationships are commonly used when fitting sinusoidal models to data or graphs.
Example:
A sinusoidal function has a maximum value of 9 and a minimum value of 1. Determine the amplitude and vertical shift.
▶️ Answer/Explanation
Amplitude
\( \text{Amplitude} = \dfrac{9 – 1}{2} = 4 \)
Vertical shift (midline)
\( \text{Midline} = \dfrac{9 + 1}{2} = 5 \)
Final answer: Amplitude = 4, Vertical shift = 5.
Example:
The maximum height of a Ferris wheel is 22 meters and the minimum height is 2 meters. Determine the amplitude and vertical shift of a sinusoidal model.
▶️ Answer/Explanation
Amplitude
\( \text{Amplitude} = \dfrac{22 – 2}{2} = 10 \)
Vertical shift (midline)
\( \text{Midline} = \dfrac{22 + 2}{2} = 12 \)
Final answer: Amplitude = 10, Vertical shift = 12 meters.
Estimating Phase Shift Using Input–Output Values
For a sinusoidal function model, the phase shift describes how far the graph is shifted horizontally from a reference sinusoidal function, such as \( y = \sin \theta \) or \( y = \cos \theta \).
An actual pair of input–output values from a real situation or dataset can be compared with the corresponding input–output values of a sinusoidal model to determine or estimate the phase shift.
If a known feature of the model, such as a maximum, minimum, or midline crossing, occurs at a different input value than expected for the basic sine or cosine function, the horizontal difference between these input values represents the phase shift.
For a function of the form
\( y = a\sin(b(\theta + c)) + d \)
the phase shift is
\( -c \)
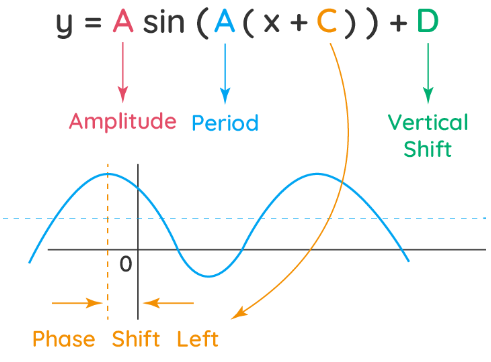
This value can be estimated by aligning an observed data point with the corresponding point on the basic sine or cosine graph.
Example:
The basic sine function \( y = \sin \theta \) reaches its first maximum at \( \theta = \dfrac{\pi}{2} \). A sinusoidal model reaches its first maximum at \( \theta = \dfrac{5\pi}{6} \). Estimate the phase shift.
▶️ Answer/Explanation
Compare the input values of the corresponding maxima.
\( \dfrac{5\pi}{6} – \dfrac{\pi}{2} = \dfrac{5\pi}{6} – \dfrac{3\pi}{6} = \dfrac{2\pi}{6} = \dfrac{\pi}{3} \)
The maximum occurs later than expected, so the graph is shifted to the right.
Final answer: The phase shift is right by \( \dfrac{\pi}{3} \).
Example:
A Ferris wheel is modeled by a sinusoidal function. The basic cosine function reaches a maximum at \( \theta = 0 \), but the observed maximum height occurs at \( \theta = 2 \). Estimate the phase shift of the model.
▶️ Answer/Explanation
For \( y = \cos \theta \), the maximum occurs at \( \theta = 0 \).
The observed maximum occurs at \( \theta = 2 \).
\( 2 – 0 = 2 \)
Since the observed maximum occurs later, the graph is shifted to the right.
Final answer: The phase shift is approximately 2 units to the right.
Constructing Sinusoidal Function Models Using Data and Technology
A sinusoidal function model can be constructed to represent a data set that exhibits periodic behavior.
Technology, such as graphing calculators or computer software, can be used to estimate key values or to perform sinusoidal regression in order to create an appropriate model.
Estimating Key Values from Data
From a data set or graph, the following quantities can be estimated:
Maximum and minimum values → amplitude and vertical shift
Distance between consecutive maxima or minima → period
Location of a key feature (maximum, minimum, or midline crossing) → phase shift
Using these estimates, a model of the form
\( y = a\sin(b(\theta + c)) + d \)
or
\( y = a\cos(b(\theta + c)) + d \)
can be constructed to approximate the data.
Sinusoidal Regression
Sinusoidal regression uses technology to automatically determine values of \( a \), \( b \), \( c \), and \( d \) that best fit a given data set.
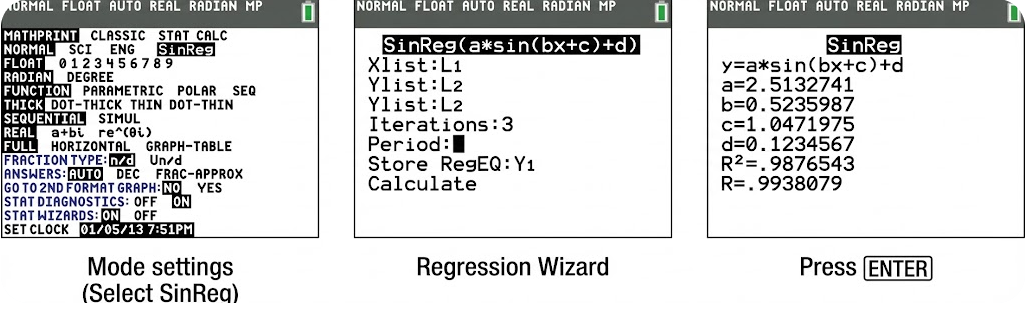
This method is especially useful when the data is noisy or when key features are difficult to identify visually.
The resulting regression equation provides a sinusoidal model that closely matches the observed behavior.
Example:
A data set shows a maximum value of 18 and a minimum value of 6. Consecutive maxima occur 12 units apart, and the first maximum occurs at \( \theta = 3 \). Construct a sinusoidal model.
▶️ Answer/Explanation
Amplitude
\( \dfrac{18 – 6}{2} = 6 \)
Midline
\( \dfrac{18 + 6}{2} = 12 \)
Period
\( 12 \Rightarrow b = \dfrac{2\pi}{12} = \dfrac{\pi}{6} \)
Phase shift
Using cosine so the maximum occurs at the phase shift:
\( y = 6\cos\!\left(\dfrac{\pi}{6}(\theta – 3)\right) + 12 \)
Example:
Explain how technology can help construct a sinusoidal model for daylight hours over a year.
▶️ Answer/Explanation
Technology can plot the data points representing daylight hours versus time.
A sinusoidal regression can then be applied to find values of \( a \), \( b \), \( c \), and \( d \).
The resulting equation models seasonal changes and can be used to make predictions.
Contextual Domain and Predictions with Sinusoidal Models
When a sinusoidal function is used to model a real-world data set, the model is typically meaningful only over a contextual domain.
The contextual domain consists of the input values for which the model makes sense within the given situation.
Outside this domain, the model may produce values that are mathematically valid but not realistic in context.
Within its contextual domain, a sinusoidal model can be used to predict values of the dependent variable from given values of the independent variable.
These predictions are based on the periodic pattern captured by the model and should always be interpreted in light of the real-world scenario.
Example:
A sinusoidal function models the height of a Ferris wheel rider over time for one full ride lasting 10 minutes.

Explain the contextual domain and how the model can be used for prediction.
▶️ Answer/Explanation
The contextual domain is the time interval from 0 to 10 minutes.
Within this interval, the model accurately represents the rider’s height.
The model can be used to predict the rider’s height at any time during the ride.
Using the model outside this interval may not reflect the actual motion of the ride.
Example:
A sinusoidal model represents average daylight hours over a year.
Explain why the model is useful only over its contextual domain and how it can be used to make predictions.
▶️ Answer/Explanation
The contextual domain is one year, such as 0 to 365 days.
Within this domain, the model captures seasonal patterns in daylight.
The model can be used to predict average daylight hours on a specific day.
Extending the model beyond this domain may ignore long-term climate changes or other factors.