Parametric Functions in \( \mathbb{R}^2 \)
A parametric function in \( \mathbb{R}^2 \), the set of all ordered pairs of real numbers, is defined using a pair of parametric equations.
In a parametric representation, both coordinates \( x \) and \( y \) are expressed as functions of a single independent variable \( t \), called the parameter.
A parametric function has the form
\( x = f(t), \quad y = g(t) \)
As the parameter \( t \) varies over an interval, the ordered pair \( (x, y) \) traces a curve in the coordinate plane.

Parametric equations are especially useful for describing motion, curves that fail the vertical line test, and paths where direction and time matter.
Example:
Consider the parametric equations
\( x = 2t + 1, \quad y = t – 3 \)
Find the point when \( t = 2 \).
▶️ Answer/Explanation
Substitute \( t = 2 \):
\( x = 2(2) + 1 = 5 \)
\( y = 2 – 3 = -1 \)
Final answer: The point is \( (5, -1) \).
Example:
A particle moves in the plane according to
\( x = \cos t, \quad y = \sin t \)
Describe the path traced as \( t \) varies.
▶️ Answer/Explanation
For every value of \( t \), the point \( (x, y) \) satisfies
\( x^2 + y^2 = \cos^2 t + \sin^2 t = 1 \)
This is the equation of a circle with radius 1 centered at the origin.
Conclusion: The parametric equations trace the unit circle counterclockwise.
Vector Form of Parametric Functions in \( \mathbb{R}^2 \)
In a parametric setting, both variables \( x \) and \( y \) depend on the same independent variable \( t \), called the parameter.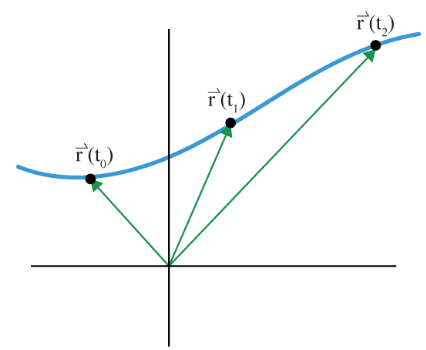
At a specific value \( t = t_i \), the coordinates of the point on the curve are
\( (x_i, y_i) = (x(t_i), y(t_i)) \)
Instead of writing two separate parametric equations, the motion or curve can be represented using a single vector-valued (parametric) function:
\( \mathbf{f}(t) = (x(t), y(t)) \)
Here, \( x(t) \) and \( y(t) \) are the names of two functions that describe the horizontal and vertical components of the motion, respectively.
As \( t \) varies over an interval, the vector-valued function \( \mathbf{f}(t) \) traces a path in the plane, with direction and position determined by the parameter.
Example:
Suppose
\( x(t) = 2t – 1, \quad y(t) = t^2 \)
Write the parametric function and find the point when \( t = 3 \).
▶️ Answer/Explanation
The vector-valued function is
\( \mathbf{f}(t) = (2t – 1, \; t^2) \)
Evaluate at \( t = 3 \):
\( \mathbf{f}(3) = (2(3) – 1, \; 3^2) = (5, 9) \)
Final answer: The point is \( (5, 9) \).
Example:
A particle moves according to the parametric function
\( \mathbf{f}(t) = (\cos t, \sin t) \)
Explain the meaning of \( \mathbf{f}\!\left(\dfrac{\pi}{2}\right) \).
▶️ Answer/Explanation
Substitute \( t = \dfrac{\pi}{2} \):
\( \mathbf{f}\!\left(\dfrac{\pi}{2}\right) = (\cos \dfrac{\pi}{2}, \sin \dfrac{\pi}{2}) = (0, 1) \)
Conclusion: At time \( t = \dfrac{\pi}{2} \), the particle is located at the point \( (0, 1) \).
Tables of Values for Parametric Functions
For a parametric function written in vector form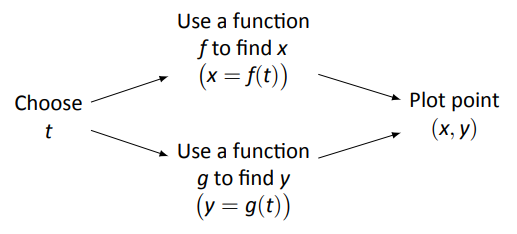
\( \mathbf{f}(t) = (x(t), y(t)) \)
a numerical table of values can be generated by selecting several values of the parameter \( t \) within its domain.
For each chosen value \( t_i \), the corresponding coordinates are found by evaluating
\( x_i = x(t_i), \quad y_i = y(t_i) \)
The ordered pairs \( (x_i, y_i) \) represent points on the curve traced by the parametric function.
Such tables are useful for sketching parametric graphs, understanding direction of motion, and interpreting real-world contexts where \( t \) often represents time.
Example:
Given the parametric function
\( x(t) = t + 1, \quad y(t) = t^2 \)
create a table of values for \( t = -1, 0, 1, 2 \).
▶️ Answer/Explanation
Evaluate \( x(t) \) and \( y(t) \) at each value of \( t \):
| \( t \) | \( x(t) \) | \( y(t) \) |
|---|---|---|
| -1 | 0 | 1 |
| 0 | 1 | 0 |
| 1 | 2 | 1 |
| 2 | 3 | 4 |
Conclusion: Each row corresponds to a point \( (x(t), y(t)) \) on the curve.
Example:
A particle moves according to
\( x(t) = \cos t, \quad y(t) = \sin t \)
Generate a table of values for \( t = 0, \dfrac{\pi}{2}, \pi, \dfrac{3\pi}{2} \).
▶️ Answer/Explanation
| \( t \) | \( x(t) \) | \( y(t) \) |
|---|---|---|
| 0 | 1 | 0 |
| \( \dfrac{\pi}{2} \) | 0 | 1 |
| \( \pi \) | -1 | 0 |
| \( \dfrac{3\pi}{2} \) | 0 | -1 |
Conclusion: The table confirms that the parametric function traces the unit circle.
Sketching Graphs of Parametric Functions
A graph of a parametric function can be sketched by first creating a numerical table of values for
\( \mathbf{f}(t) = (x(t), y(t)) \)
at several values of the parameter \( t \) within its domain.
Each value of \( t \) produces a point \( (x(t), y(t)) \) in the coordinate plane.
The graph is then formed by plotting these points and connecting them in the order of increasing values of \( t \).
The order is important because it shows the direction of motion along the curve as \( t \) increases.
This method allows curves that cannot be written as single equations of the form \( y = f(x) \) to be represented graphically.
Example:
Sketch the graph of the parametric equations
\( x(t) = t, \quad y(t) = t^2 \)
for \( -2 \le t \le 2 \).
▶️ Answer/Explanation
| \( t \) | \( x(t) \) | \( y(t) \) |
|---|---|---|
| -2 | -2 | 4 |
| -1 | -1 | 1 |
| 0 | 0 | 0 |
| 1 | 1 | 1 |
| 2 | 2 | 4 |
Plot the points and connect them in order of increasing \( t \).
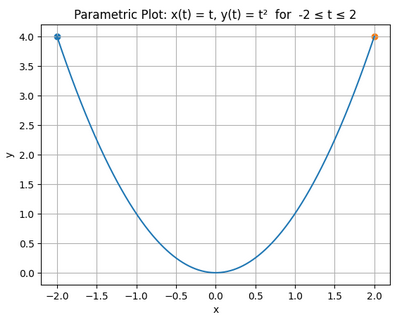
Conclusion: The graph is a parabola opening upward, traced from left to right as \( t \) increases.
Example:
Sketch the parametric curve defined by
\( x(t) = \cos t, \quad y(t) = \sin t \)
for \( 0 \le t \le 2\pi \).
▶️ Answer/Explanation
Select key values of \( t \):
| \( t \) | \( x(t) \) | \( y(t) \) |
|---|---|---|
| 0 | 1 | 0 |
| \( \dfrac{\pi}{2} \) | 0 | 1 |
| \( \pi \) | -1 | 0 |
| \( \dfrac{3\pi}{2} \) | 0 | -1 |
| \( 2\pi \) | 1 | 0 |
Plot the points and connect them in order of increasing \( t \).
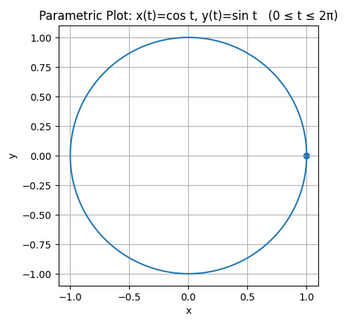
Conclusion: The curve is a unit circle traced counterclockwise starting at \( (1,0) \).
Restricted Domains of Parametric Functions
For a parametric function written as
\( \mathbf{f}(t) = (x(t), y(t)) \)
the domain consists of the values of the parameter \( t \) for which the functions \( x(t) \) and \( y(t) \) are defined.
In many situations, the domain of \( t \) is restricted to a specific interval, rather than all real numbers.
Restricting the domain of \( t \) results in a graph that has a clear starting point and ending point.
The starting point corresponds to the smallest value of \( t \) in the domain, and the ending point corresponds to the largest value of \( t \).
This is especially important in applications involving motion, where \( t \) often represents time and the curve represents a path traced over a finite interval.
Example:
Describe the parametric equations
\( x(t) = t, \quad y(t) = t^2 \)
with domain \( 0 \le t \le 2 \).
▶️ Answer/Explanation
Evaluate the endpoints of the domain:
\( \mathbf{f}(0) = (0, 0) \)
\( \mathbf{f}(2) = (2, 4) \)
The graph starts at \( (0,0) \) and ends at \( (2,4) \).
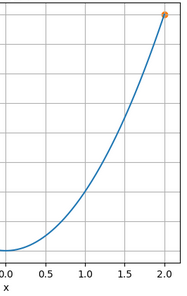
Conclusion: Restricting the domain produces only part of the parabola, with clear start and end points.
Example:
Describe parametric function
\( x(t) = \sqrt{t-4}, \quad y(t) = 2t \)
▶️ Answer/Explanation
Since \( x(t) = \sqrt{t-4} \), the parameter must satisfy \( t \ge 4 \).
Eliminating the parameter:
\( t = \dfrac{y}{2} \)
\( x = \sqrt{\dfrac{y}{2} – 4} \)
Squaring both sides gives:
\( y = 2x^2 + 8 \)
As \( t \) increases, the curve traces an upward-opening parabola, starting from the point \( (0, 8) \) and moving to the right.
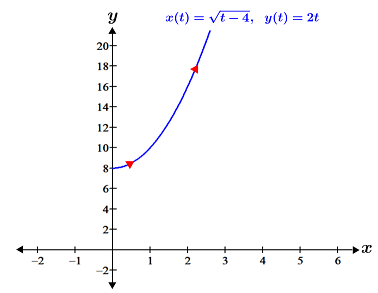
Conclusion: The parameter restriction ensures the curve begins at a defined point and traces only the valid portion of the parabola.