Home / AP® Exam / AP® Statistics / 1.1 Introducing Statistics: What Can We Learn from Data?- MCQs

AP Statistics 1.1 Introducing Statistics: What Can We Learn from Data?- MCQs - Exam Style Questions

Question

The histogram below summarizes the distribution of personal income per capita (in thousands of dollars) for each of the \(50\) states and the District of Columbia.
Which of the following best describes the shape of this distribution and the most likely relationship between the mean and median of this distribution?
(A) Skewed left; \(mean<median\)
(B) Skewed left; \(mean>median\)
(C) Skewed right; \(mean<median\)
(D) Skewed right; \(mean>median\)
(E) Symmetric; \(mean=median\)
▶️ Answer/Explanation
Detailed solution

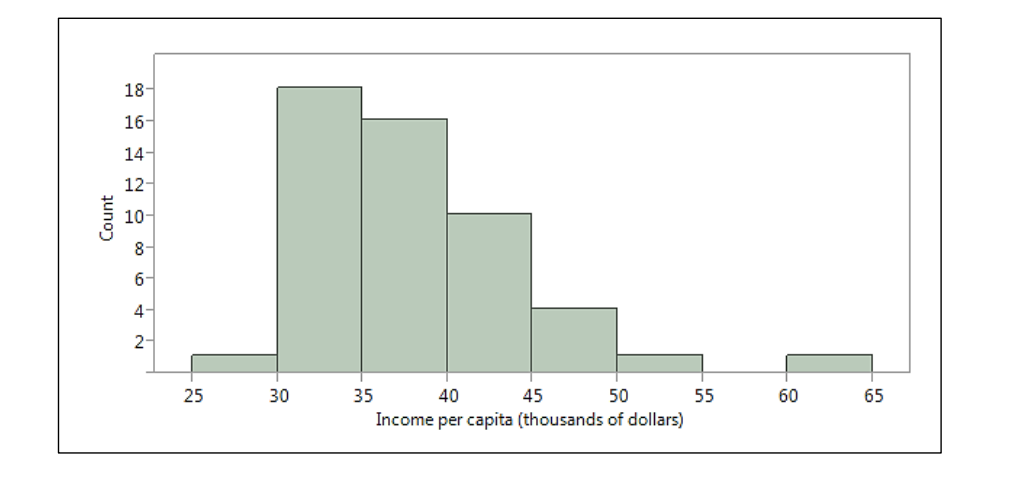
1. Analyze the Shape:
The distribution has a main cluster of data on the left side and a “tail” of less frequent, higher values stretching out to the right. This is the definition of a **skewed right** distribution.

2. Relationship Between Mean and Median:
In a skewed right distribution, the high-value outliers in the tail pull the mean in that direction. The median is resistant to outliers and stays closer to the main cluster of data. Therefore, the **mean will be greater than the median**.
Answer: (D)

Scroll to Top