AP Statistics 1.3 Tabular Representation and Summary Statistics for One Categorical Variable- Exam Style Questions - MCQs - New Syllabus
Question
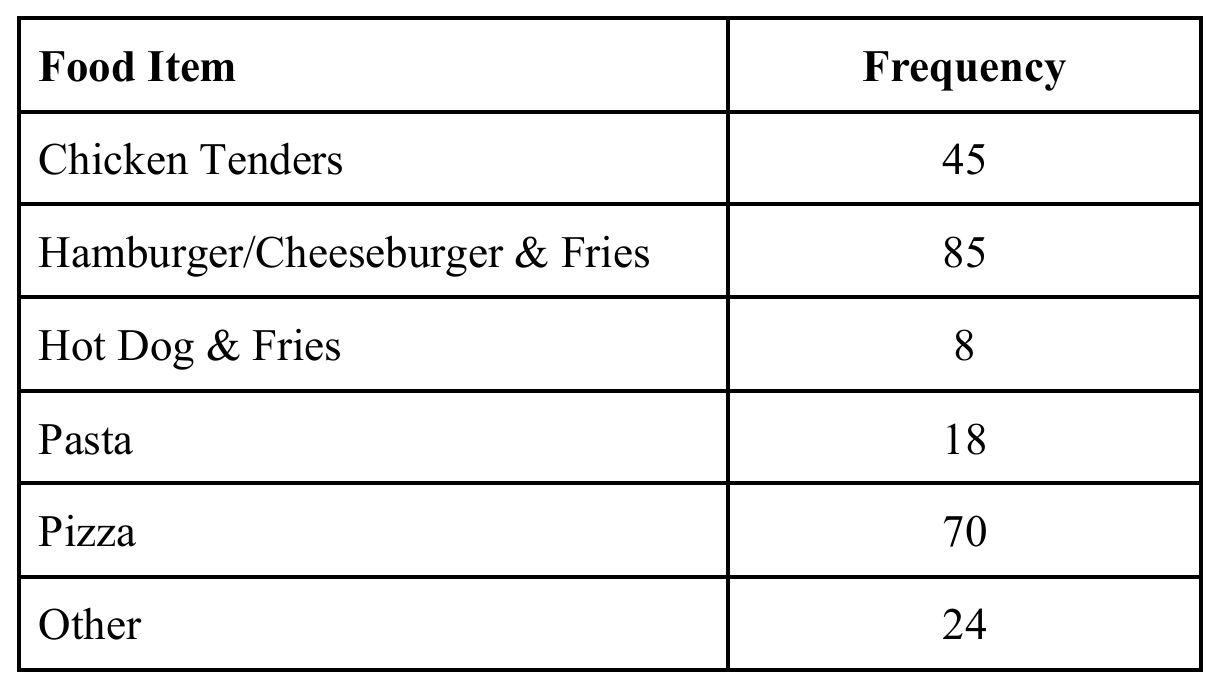
A group of high school students were asked to name their favorite cafeteria meal. The following frequency table shows their responses:

Which of the following statements is not supported by the table?
(A) More students chose Chicken Tenders than chose Pasta.
(B) 250 total students responded.
(C) A majority of the students chose the Hamburger/Cheeseburger & Fries option.
(D) Less than one-third of the students chose Pizza.
(E) The proportion of students choosing Hamburger/Cheeseburger & Fries is 6% greater than the proportion of students choosing Pizza.
▶️ Answer/Explanation
First find the total number of students:
\(45 + 85 + 8 + 18 + 70 + 24 = 250\)
The Hamburger/Cheeseburger & Fries option was chosen by 85 students. Since
\(\frac{85}{250}=0.34=34\%\)
This is not more than 50%, it does not represent a majority of the students. Therefore statement (C) is not supported by the data. The remaining statements are consistent with the frequencies and proportions shown in the table.
✅ Answer: (C)
Question
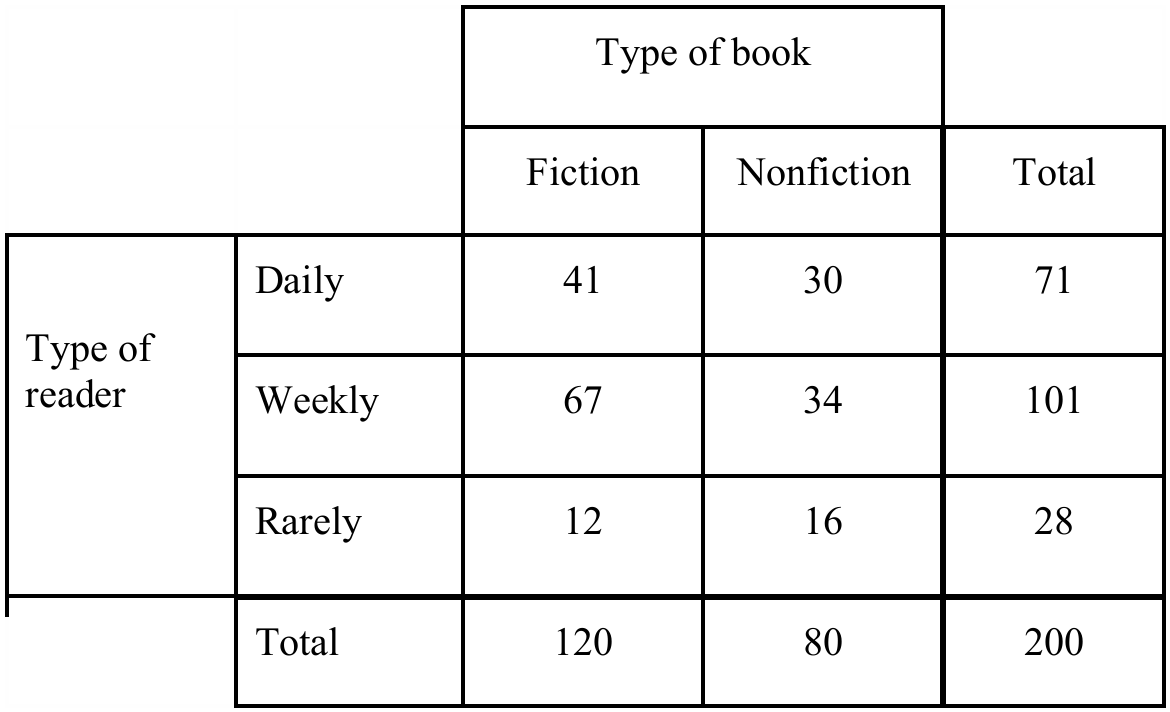
Two hundred people were interviewed and asked about their reading habits. The people were classified by type of reader (daily, weekly, rarely) and by preference type of book (fiction, nonfiction). The results are shown in the following table:

Which of the following statements is true?
(A) More than half of the 200 people interviewed read weekly and prefer fiction.
(B) The proportion who read daily is higher among people who prefer fiction than nonfiction.
(C) For each type of reader, more people prefer fiction to nonfiction.
(D) Of the three types of readers, weekly readers have the highest proportion of nonfiction readers.
(E) Of the two types of books, fiction has a higher proportion of weekly readers than nonfiction.
▶️ Answer/Explanation
To compare the proportion of weekly readers within each book preference category, calculate:
Fiction weekly readers:
\( \frac{67}{120} \approx 0.558 \)
Nonfiction weekly readers:
\( \frac{34}{80} = 0.425 \)
Since \(0.558 > 0.425\), fiction has a higher proportion of weekly readers than nonfiction. The other statements are false because they either compare incorrect proportions or make claims that are not supported by the table. Therefore, statement (E) is the only true statement.
✅ Answer: (E)
Question
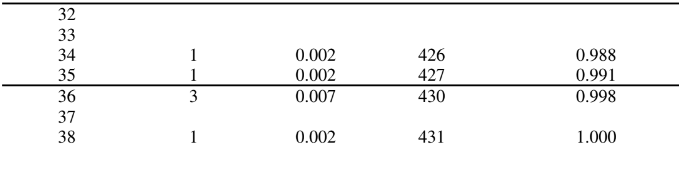
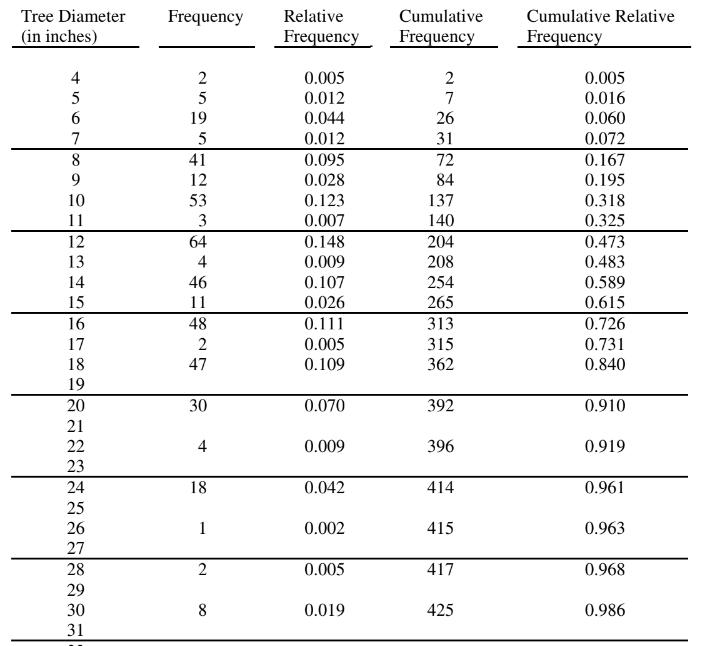
In the 1830s, land surveyors began to survey the land acquired in the Louisiana Purchase. Part of their task was to note the sizes of trees they encountered in their surveying. The table of data below is for bur oak trees measured during the survey.


Which of the following differences in cumulative relative frequencies gives the proportion of trees that are 12 inches to 16 inches, inclusive, in diameter?
(A) \(0.615-0.325\)
(B) \(0.615-0.473\)
(C) \(0.726-0.325\)
(D) \(0.726-0.473\)
(E) \(0.731-0.325\)
▶️ Answer/Explanation
Step‑by‑step solution:
The cumulative relative frequency up to a certain diameter gives the proportion of trees with diameter less than or equal to that value. To obtain the proportion of trees whose diameter falls between 12 and 16 inches inclusive, subtract the cumulative relative frequency up to 12 inches from the cumulative relative frequency up to 16 inches. From the table, the cumulative relative frequency up to 12 inches is \(0.325\) and the cumulative relative frequency up to 16 inches is \(0.726\). Therefore, the required proportion is \(0.726 – 0.325\).
✅ Correct answer: (C)