
▶️ Answer/Explanation
Detailed solution
(a)
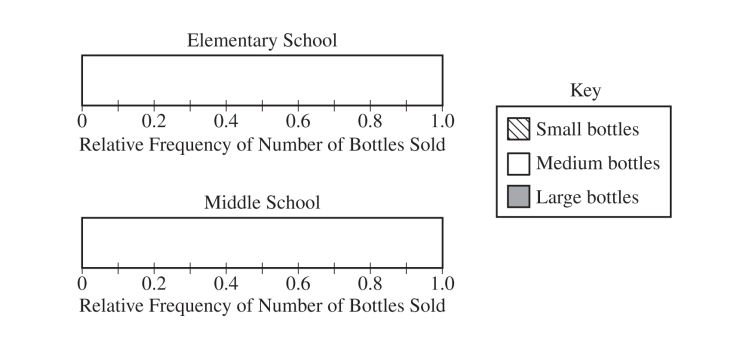
The completed segmented bar graphs are shown below.
The completed segmented bar graphs are shown below.
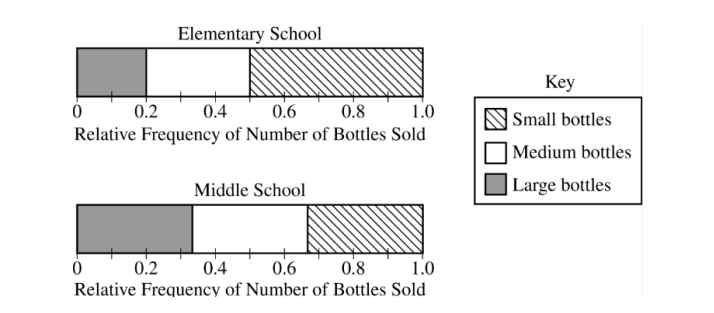
For the elementary school, the relative frequencies are \(0.5\), \(0.3\), and \(0.2\). Therefore, the segmented bar should be divided at \(0.5\), then at \(0.5+0.3=0.8\), and finally at \(1.0\). The segments represent small, medium, and large bottles, respectively.
For the middle school, the proportions are equal for all three sizes. Therefore, each size represents \(\frac{1}{3}\) of the total number of bottles sold. The segmented bar should be divided at \(\frac{1}{3}\approx 0.33\), then at \(\frac{2}{3}\approx 0.67\), and finally at \(1.0\).
(b)
No, the elementary school administrator’s conclusion is incorrect.
No, the elementary school administrator’s conclusion is incorrect.
Although the elementary school had a greater proportion of small bottles sold, the middle school sold three times as many bottles in total. Let \(N\) be the total number of bottles sold by the elementary school. Then the middle school sold \(3N\) bottles.
Number of small bottles sold by the elementary school:
\(0.5N\)
\(0.5N\)
Number of small bottles sold by the middle school:
\(\frac{1}{3}(3N)=N\)
\(\frac{1}{3}(3N)=N\)
Since \(N>0.5N\), the middle school sold more small bottles than the elementary school. The administrator confused a greater proportion with a greater actual number.
(c)(i)
High School A sold a greater proportion of large bottles.
High School A sold a greater proportion of large bottles.
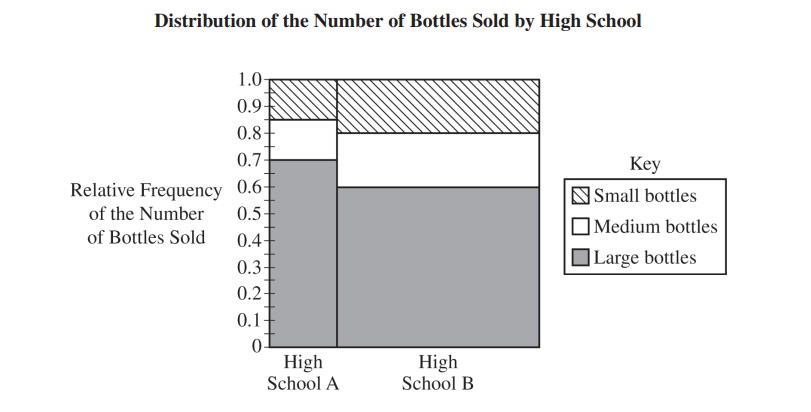
In a mosaic plot, the proportion within a school is represented by the vertical height of the corresponding segment. For High School A, the large-bottle segment extends from about \(0.7\) to \(1.0\), giving a height of \(0.3\). For High School B, the large-bottle segment extends from about \(0.6\) to \(0.8\), giving a height of \(0.2\). Since \(0.3>0.2\), High School A sold a greater proportion of large bottles.
(c)(ii)
High School B sold a greater number of large bottles.
High School B sold a greater number of large bottles.
In a mosaic plot, the number of items in a category is represented by the area of the rectangle, not just the height. The area is based on both the width of the school group and the height of the large-bottle segment. High School B has a much wider rectangle than High School A, so even though its large-bottle proportion is smaller, the area of its large-bottle rectangle is greater. Therefore, High School B sold a greater number of large bottles.