▶️ Answer/Explanation
(a)
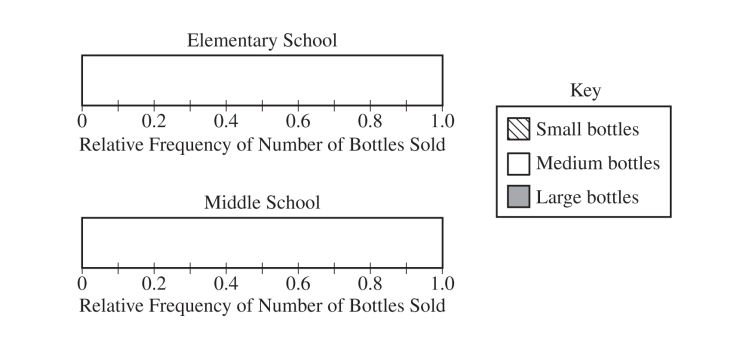
The completed segmented bar graphs are shown below.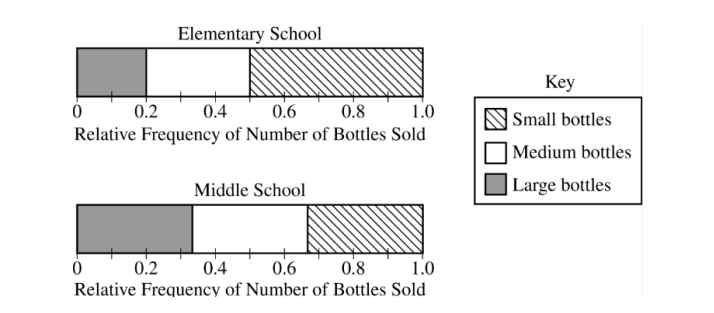
– For the Elementary School, the segments are partitioned at \(0.5\) (for Small), \(0.8\) (for Medium, \(0.5+0.3\)), and \(1.0\) (for Large, \(0.8+0.2\)).
– For the Middle School, the proportions are equal for all three sizes, so each size represents \(\frac{1}{3}\) of the total. The segments are partitioned at \(\frac{1}{3} \approx 0.33\) and \(\frac{2}{3} \approx 0.67\).
(b)
No, the elementary school administrator’s conclusion is incorrect.
Explanation:
Although the proportion of small bottles sold by the elementary school (\(0.5\)) is greater than the proportion sold by the middle school (\(\approx 0.33\)), the middle school sold three times as many total bottles. Let \(N\) be the total number of bottles sold by the elementary school. Then the middle school sold \(3N\) bottles.
– Number of small bottles sold by Elementary: \(0.5 \times N\)
– Number of small bottles sold by Middle: \(\frac{1}{3} \times (3N) = N\)
Since \(N > 0.5N\), the middle school sold more small bottles.
(c)
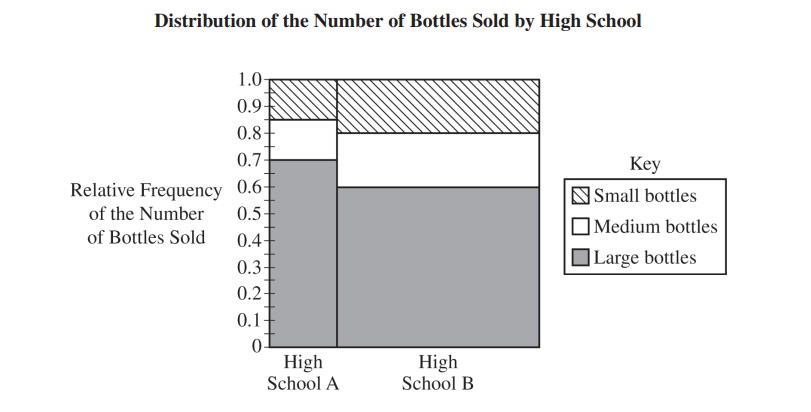
(i) High School A sold a greater proportion of large bottles.
Justification: The proportion is represented by the height of the segment. The segment for “Large bottles” is taller for High School A (from \(0.7\) to \(1.0\), a height of \(0.3\)) than for High School B (from \(0.6\) to \(0.8\), a height of \(0.2\)).
(ii) High School B sold a greater number of large bottles.
Justification: The number of bottles is represented by the area of the rectangle (height \(\times\) width). The rectangle for large bottles at High School B is visibly wider than the rectangle for High School A. Although it is shorter, its greater width gives it a larger overall area, representing a greater number of large bottles sold.