Home / AP® Exam / AP® Statistics / AP Statistics 1.5 Graphical Representations for One Quantitative Variable- Exam Style Questions – MCQs

AP Statistics 1.5 Graphical Representations for One Quantitative Variable- Exam Style Questions - MCQs - New Syllabus

Question

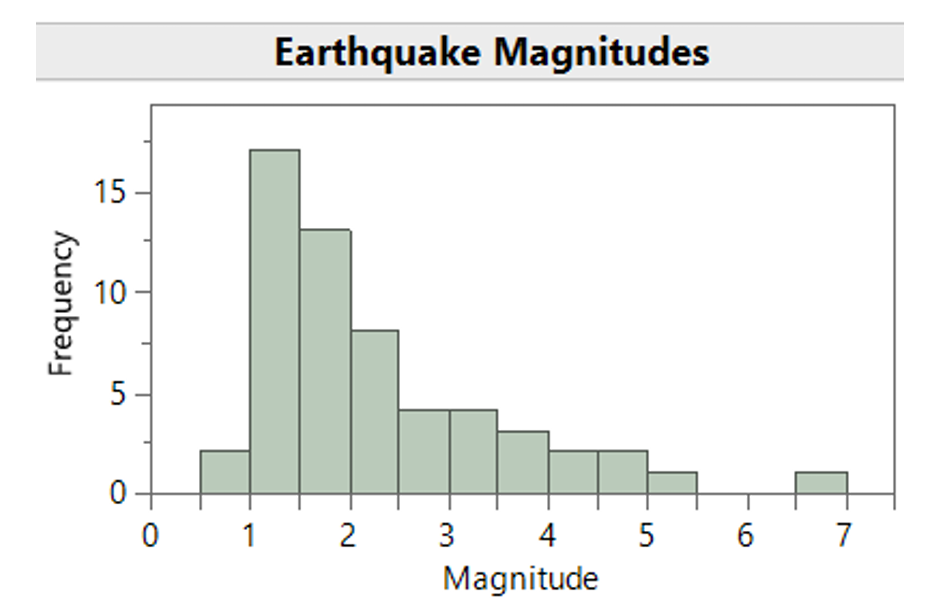
The histogram below shows magnitudes for 57 earthquakes.

Which interval will include the median magnitude for these 57 earthquakes?

(A) 1.0 to 1.5
(B) 1.5 to 2.0
(C) 2.5 to 3.0
(D) 3.5 to 4.0
(E) 6.5 to 7.0

▶️ Answer/Explanation

There are 57 earthquakes, so the median is the 29th observation when the data are ordered from smallest to largest.

\(\text{Median Position}=\frac{57+1}{2}=29\)

From the histogram, approximately 2 earthquakes fall in the interval 0.5–1.0 and about 17 fall in 1.0–1.5, giving a cumulative count of about 19. The next interval, 1.5–2.0, contains about 13 earthquakes, bringing the cumulative count to about 32.

Since the 29th observation falls within the interval 1.5–2.0, the median magnitude must lie in that class interval.
Answer: (B)

Question

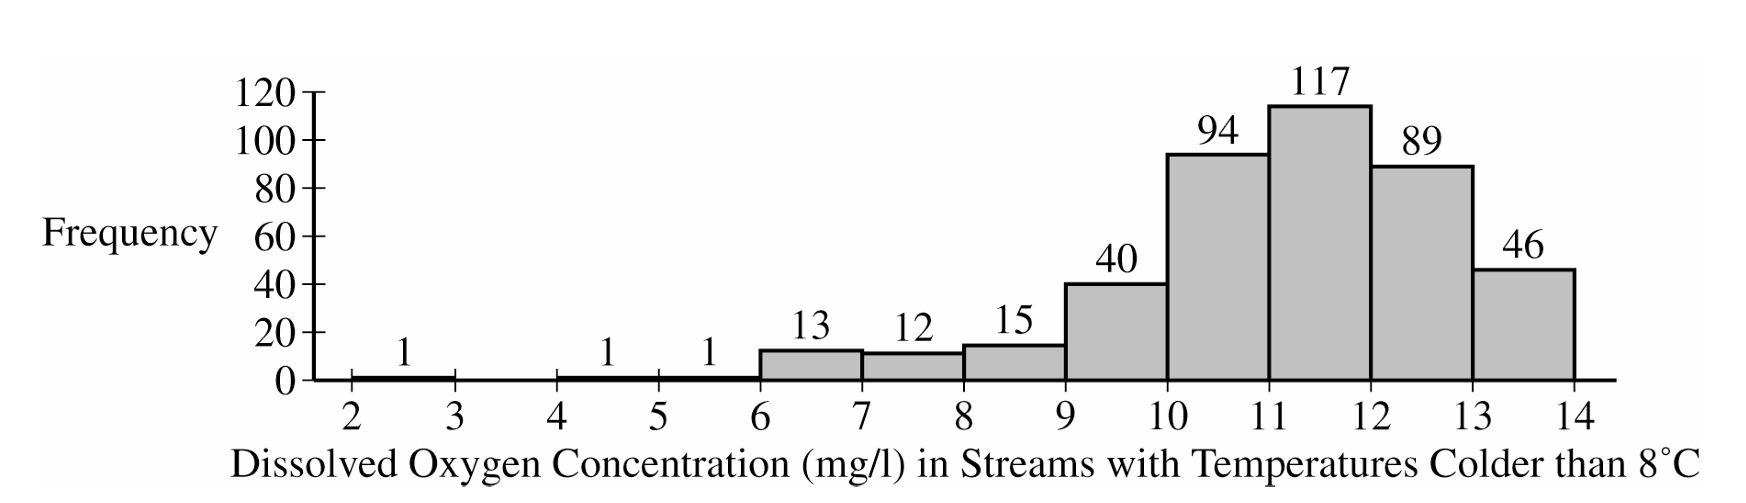
As part of a study on the chemistry of Alaskan streams, researchers took water samples from many streams with temperatures colder than \(8^\circ\text{C}\) and from many streams with temperatures warmer than \(8^\circ\text{C}\). For each sample, the researchers measured the dissolved oxygen concentration, in milligrams per liter \((\text{mg/l})\).
Based on the histogram for streams with water temperatures colder than \(8^\circ\text{C}\), which of the following best describes the distribution of dissolved oxygen concentration?
(A) The distribution is approximately symmetric with a center near \(6\,\text{mg/l}\).
(B) The distribution is skewed to the right with most values between \(2\,\text{mg/l}\) and \(6\,\text{mg/l}\).
(C) The distribution is skewed to the left with most values between \(10\,\text{mg/l}\) and \(13\,\text{mg/l}\).
(D) The distribution is uniform from \(2\,\text{mg/l}\) to \(14\,\text{mg/l}\).
▶️ Answer/Explanation

The histogram has most of the observations concentrated at higher dissolved oxygen values, especially between about \(10\,\text{mg/l}\) and \(13\,\text{mg/l}\).
There are a few much smaller values extending toward the left side of the graph, from about \(2\,\text{mg/l}\) to \(6\,\text{mg/l}\). This creates a left tail.
Therefore, the distribution is skewed to the left, with its center around \(11\) to \(12\,\text{mg/l}\).

Answer: (C)

Question

The researchers computed the summary statistics shown in the table for the dissolved oxygen concentration in streams from the sample with water temperatures warmer than \(8^\circ\text{C}\).
Summary Statistics for Dissolved Oxygen Concentration in Streams Warmer Than \(8^\circ\text{C}\)
Min\(Q_1\)Median\(Q_3\)MaxMeanStd. Dev.
\(2.10\)\(4.39\)\(5.43\)\(6.12\)\(13.45\)\(5.54\)\(1.64\)
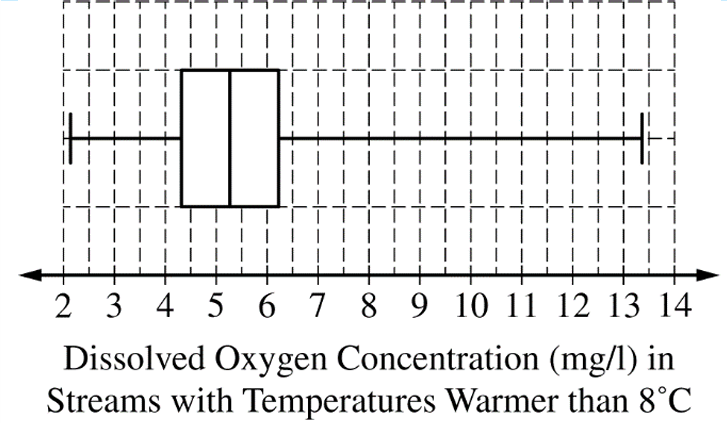
Which of the following correctly describes the box plot that should be constructed from the summary statistics, without indicating outliers?
(A) The box extends from \(4.39\) to \(6.12\), the median is at \(5.43\), and the whiskers extend to \(2.10\) and \(13.45\).
(B) The box extends from \(2.10\) to \(13.45\), the median is at \(5.54\), and the whiskers extend to \(4.39\) and \(6.12\).
(C) The box extends from \(5.43\) to \(5.54\), the median is at \(4.39\), and the whiskers extend to \(2.10\) and \(13.45\).
(D) The box extends from \(4.39\) to \(5.43\), the median is at \(6.12\), and the whiskers extend to \(2.10\) and \(13.45\).
▶️ Answer/Explanation

A box plot is constructed using the five-number summary: minimum, \(Q_1\), median, \(Q_3\), and maximum.

From the table:
Minimum \(=2.10\)
\(Q_1=4.39\)
Median \(=5.43\)
\(Q_3=6.12\)
Maximum \(=13.45\)

Therefore, the box should extend from \(4.39\) to \(6.12\), with a median line at \(5.43\). The whiskers should extend to \(2.10\) and \(13.45\), since the problem says not to indicate outliers.

Answer: (A)

Scroll to Top