Home / AP® Exam / AP® Statistics / 1.5 Representing a Quantitative Variable with Graphs MCQs

AP Statistics 1.5 Representing a Quantitative Variable with Graphs MCQs - Exam Style Questions

Question

Which of the following histograms could have been constructed from the same set of data summarized by the boxplot above?
▶️ Answer/Explanation
Detailed solution

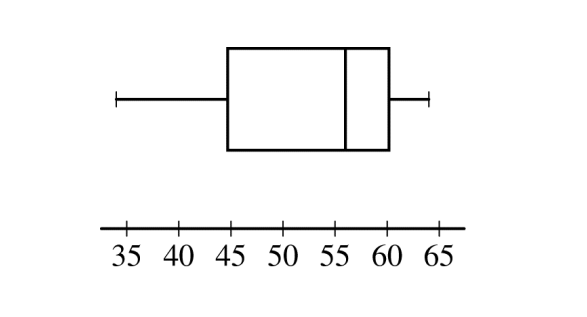
1. Read Key Features from the Boxplot:
– Range: The data spans from approximately \(35\) to \(65\).
– Median: The median is at \(56\).
– Shape: The median is shifted to the right side of the box, and the left whisker is longer than the right whisker. This indicates the distribution is **skewed to the left**.

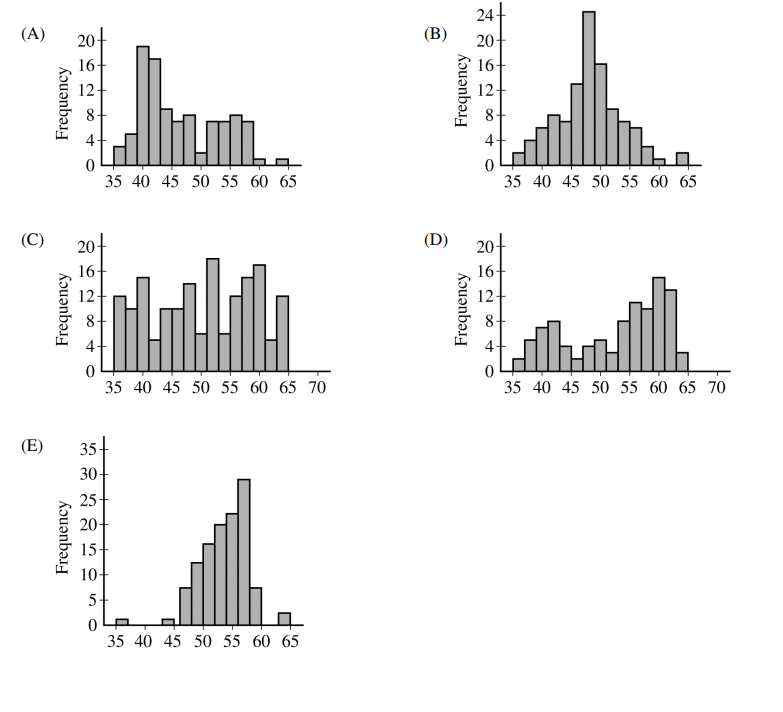
2. Analyze the Histograms:
– (A) is roughly symmetric.
– (B) is skewed to the right.
– (C) is skewed to the right.
– (E) is roughly symmetric and bimodal.
– (D) clearly shows a cluster of data on the right with a tail extending to the left. This is the only histogram that matches the left-skewed shape of the boxplot.
Answer: (D)

Question

A school is having a contest in which students guess the number of candies in a jar. The student whose guess is closest to the correct number of candies in the jar wins a prize. The number of candies guessed by male and female students is shown in the back-to-back stemplot below.
$$ \begin{array}{r|c|l} {\textbf{Male}} & \textbf{Stem} & {\textbf{Female}} \\ \hline & 6 & 4 \\ 2 & 7 & 5\ 8 \\ 1 & 8 & 0\ 9 \\ 0 & 9 & 0\ 0\ 5 \\ 0\ 0 & 10 & 0\ 0\ 1\ 4 \\ 5\ 5\ 3\ 0 & 11 & 0\ 0\ 5\ 7\ 8\ 8 \\ 5\ 5\ 5\ 4\ 2\ 1\ 0 & 12 & 0\ 1\ 1\ 2 \\ 8\ 6\ 5\ 0\ 0\ 0 & 13 & \\ 9\ 5\ 0 & 14 & \\ {\text{Key: } 6|4 = 64} \end{array} $$
Which of the following statements is true about the distributions of guesses?
(A) The distribution of guesses for male students is skewed to the left, and the distribution of guesses for female students is skewed to the right.
(B) The distribution of guesses for male students is skewed to the right, and the distribution of guesses for female students is skewed to the left.
(C) The distributions of guesses for male and female students are both skewed to the right.
(D) The distributions of guesses for male and female students are both skewed to the left.
(E) The distributions of guesses for male and female students are both symmetric.
▶️ Answer/Explanation
Detailed solution

1. Analyze the Shape of the Male Distribution:
For the male students (left side), most of the data is concentrated at the higher stems (from \(10\) to \(14\)). The “tail” of the distribution, where the data is less frequent, extends downwards to the lower values. This indicates the distribution is **skewed to the left**.

2. Analyze the Shape of the Female Distribution:
For the female students (right side), the data is also concentrated at the higher stems (from \(10\) to \(12\)). The tail extends downwards to the lower values (stems \(6, 7, 8, 9\)). This distribution is also **skewed to the left**.

Both distributions are skewed to the left.
Answer: (D)

Scroll to Top