
▶️ Answer/Explanation
The distribution shows two distinct peaks — one centered around \(10\) and another around \(17\).
Between \(1\) and \(8\), there are no observed data values, clearly indicating a gap in the distribution.
This eliminates option (A) because the shape is not approximately normal (not mound-shaped or symmetric).
Option (B) is incorrect because although the distribution is bimodal, there is a gap present.
Option (D) and (E) are incorrect because the distribution is not skewed to the right — skewness would require a longer right tail, which is not the case here.
Therefore, the correct description is: \[ \text{Bimodal with a gap between 1 and 8, modes at 10 and 17.} \] ✅ Answer: (C)
▶️ Answer/Explanation
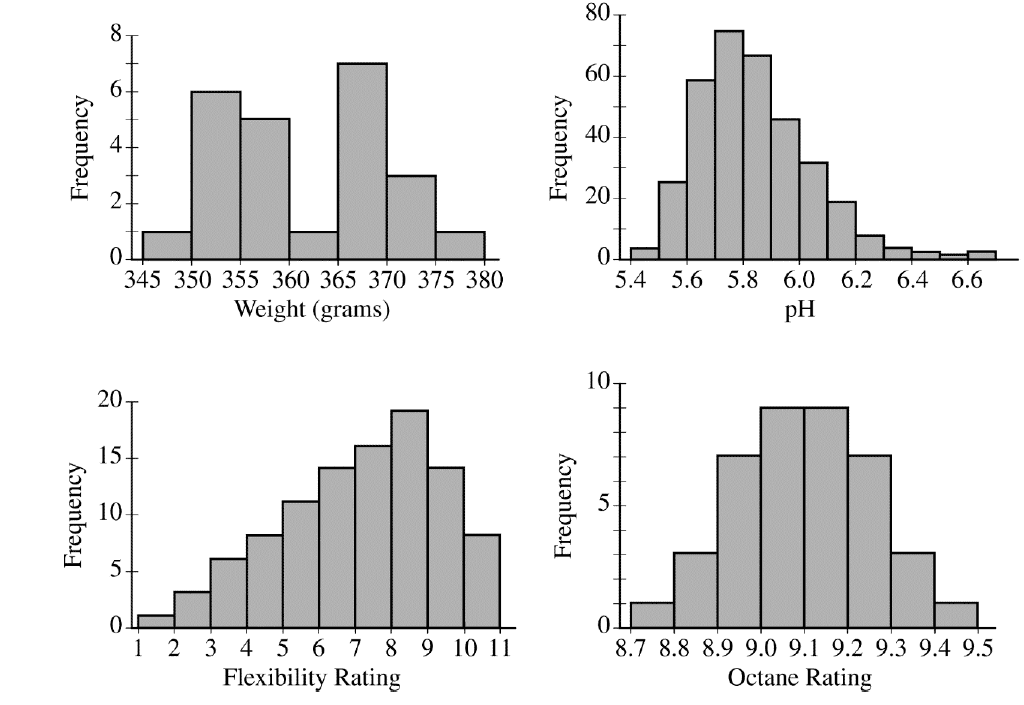
Inspect each histogram and match to a listed shape.
• Weight (grams): two distinct peaks ⇒ bimodal → matches option (B).
• pH: long right tail ⇒ skewed to the right → matches option (D).
• Flexibility Rating: tail extends to the left ⇒ skewed to the left → matches option (C).
• Octane Rating: mound-shaped and balanced ⇒ symmetric and unimodal → matches option (E).
The only shape not appearing among the four is uniform.
✅ Answer: (A)