AP Statistics 1.7 Summary Statistics for One Quantitative Variable- Exam Style Questions - MCQs - New Syllabus
Question
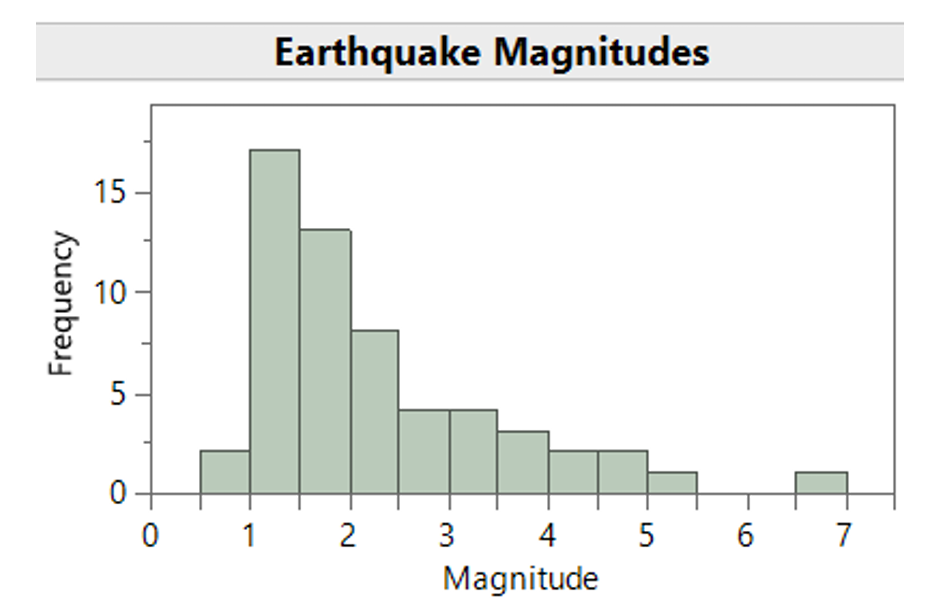
The histogram below shows magnitudes for 57 earthquakes.

Which interval will include the median magnitude for these 57 earthquakes?
(A) 1.0 to 1.5
(B) 1.5 to 2.0
(C) 2.5 to 3.0
(D) 3.5 to 4.0
(E) 6.5 to 7.0
▶️ Answer/Explanation
There are 57 earthquakes, so the median is the 29th observation when the data are ordered from smallest to largest.
\(\text{Median Position}=\frac{57+1}{2}=29\)
From the histogram, approximately 2 earthquakes fall in the interval 0.5–1.0 and about 17 fall in 1.0–1.5, giving a cumulative count of about 19. The next interval, 1.5–2.0, contains about 13 earthquakes, bringing the cumulative count to about 32.
Since the 29th observation falls within the interval 1.5–2.0, the median magnitude must lie in that class interval.
✅ Answer: (B)

Question
The statistics below provide a summary of the distribution of heights, in inches, for a simple random sample of 200 young children.
Mean: 46 inches
Median: 45 inches
Standard Deviation: 3 inches
First Quartile: 43 inches
Third Quartile: 48 inches
About 100 children in the sample have heights that are
(A) less than 43 inches
(B) less than 48 inches
(C) between 43 and 48 inches
(D) between 40 and 52 inches
(E) more than 46 inches
▶️ Answer/Explanation
The first quartile (Q1) is 43 inches and the third quartile (Q3) is 48 inches. By definition, the interval from Q1 to Q3 contains the middle 50% of the observations.
Since the sample size is 200 children:
\( 50\% \times 200 = 100 \)
Therefore, approximately 100 children have heights between 43 inches and 48 inches. The other choices correspond to different percentages of the distribution and cannot be determined to be about 100 children from the information given.
✅ Answer: (C)
Question
The table above shows the sample size, the mean, and the median for two samples of measurements. What is the median for the combined sample of 47 measurements?

(A) \( \frac{42.6+49.2}{2} \)
(B) \( \frac{45.0+48.5}{2} \)
(C) \( \frac{21(42.6)+26(49.2)}{47} \)
(D) \( \frac{21(45.0)+26(48.5)}{47} \)
(E) It cannot be determined from the information given.
▶️ Answer/Explanation
The means and medians of the two separate samples do not provide enough information to determine the median of the combined data set.
To find the median of the combined sample of 47 observations, we would need to know the actual ordering of all 47 values. Different data sets can have the same sample sizes, means, and medians but produce different combined medians.
While choice (C) correctly computes the combined mean, none of the formulas shown can be used to determine the combined median from the information given.
Therefore, the median of the combined sample cannot be determined.
✅ Answer: (E)
