Home / AP® Exam / AP® Statistics / 1.8 Graphical Representations of Summary Statistics – MCQs

AP Statistics 1.8 Graphical Representations of Summary Statistics - MCQs - Exam Style Questions

Question

Data were collected on the number of text messages sent by each student in a large high school for one day. A boxplot of the data is shown below.
Based on the boxplot, which of the following statements is the most reasonable conclusion?
(A) There are more students with data values below the median than there are students with data values above the median.
(B) There are more students with data values between the first quartile and the median than there are students with data values between the median and the third quartile.
(C) There are fewer students with data values between the first quartile and the median than there are students with data values between the median and the third quartile.
(D) There are approximately the same number of students with data values between the first quartile and the minimum as there are students with data values between the third quartile and the maximum.
(E) The data are less spread out between the first quartile and the median than between the median and the third quartile.
▶️ Answer/Explanation
Detailed solution

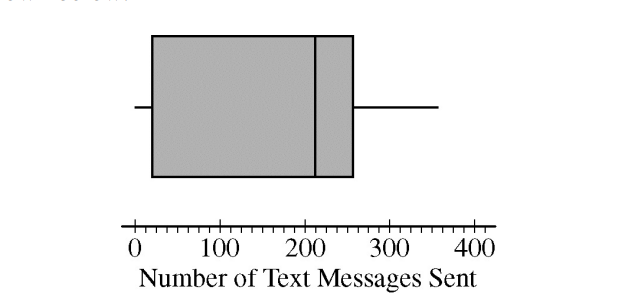
A boxplot is constructed based on quartiles, which divide the data into four sections, each containing approximately \(25\%\) of the data points (students).

– The range from the minimum to the first quartile (Q1) contains \(25\%\) of the students.
– The range from the third quartile (Q3) to the maximum contains \(25\%\) of the students.

Therefore, the number of students in these two sections is approximately the same. The visual width of a section indicates the spread of the data values, not the number of data points.
Answer: (D)

Question 

The pulse rate for each person in a sample of \(20\) men and \(20\) women was recorded. The boxplots below summarize the pulse rates for the men and the women in the sample.
Which of the following statements about the people in the sample must be true?
(A) There are more people between the first and third quartiles for women than there are between the first and third quartiles for men.
(B) The person with the lowest pulse rate is a woman.
(C) At least half of the women had higher pulse rates than three-fourths of the men.
(D) More than half of the men had lower pulse rates than three-fourths of the women.
(E) If a man and a woman were randomly selected from the \(40\) people, the man would have the lower pulse rate.
▶️ Answer/Explanation
Detailed solution

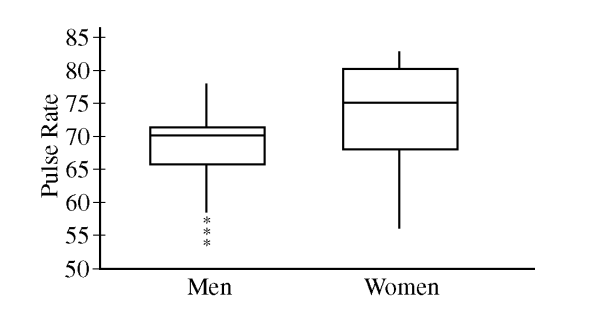
1. Read Key Values from the Boxplots:
– For Men: The third quartile (\(Q_3\)) is approximately \(71\).
– For Women: The median (\(Q_2\)) is approximately \(75\).

2. Analyze Statement (C):
– “At least half of the women” refers to the top \(50\%\) of women, whose pulse rates are above the median of \(75\).
– “Three-fourths of the men” refers to the bottom \(75\%\) of men, whose pulse rates are below their \(Q_3\) of \(71\).

Since the women’s median (\(75\)) is greater than the men’s third quartile (\(71\)), it must be true that at least \(50\%\) of women have pulse rates higher than at least \(75\%\) of men.
Answer: (C)

Scroll to Top