▶️ Answer/Explanation
(a)
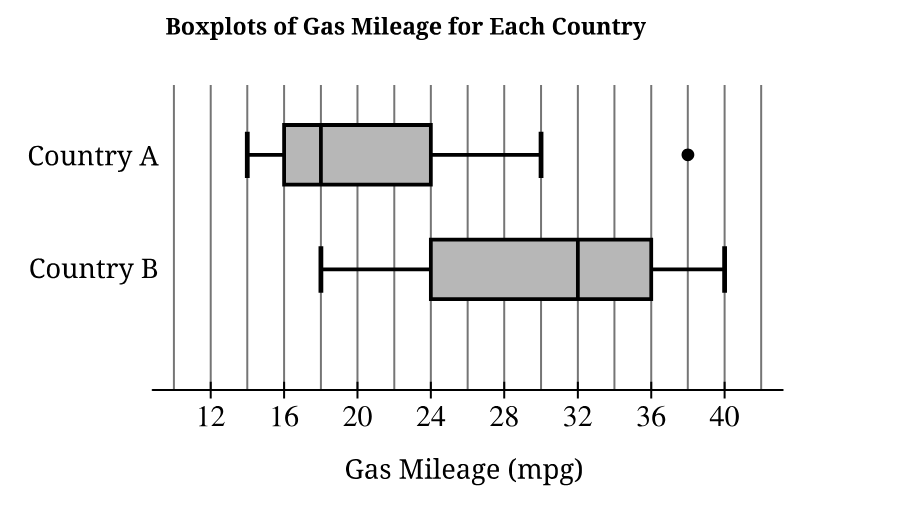
– Center: The distribution of gas mileage for Country A has a lower center than Country B. The median gas mileage for Country A (approximately \(18\) mpg) is significantly lower than the median for Country B (approximately \(32\) mpg).
– Spread: The distribution for Country B has a larger interquartile range (IQR \(\approx 36-24=12\) mpg) than Country A (IQR \(\approx 24-16=8\) mpg). The overall range for Country A (\(\approx 38-14=24\) mpg) is slightly larger than the range for Country B (\(\approx 40-18=22\) mpg).
– Shape/Unusual Features: The distribution for Country A appears to be skewed to the right. The distribution for Country B appears to be skewed to the left. The distribution for Country A has at least one high outlier, indicated by the dot at approximately \(38\) mpg.
(b)
The mean gas mileage for Country A is expected to be greater than \(18\) mpg. The median for this distribution is \(18\) mpg. Because the distribution is skewed to the right and includes a high outlier, the mean (which is not resistant) will be pulled toward the larger values, making it greater than the median (which is resistant).
(c)
(i) The range of the combined data set is \(26\) mpg.
Justification: The overall minimum value is from Country A (\(14\) mpg) and the overall maximum value is from Country B (\(40\) mpg). The combined range is \(\text{Maximum} – \text{Minimum} = 40 – 14 = 26\) mpg.
(ii) A possible value for the median is \(24\) mpg.
Justification: There are \(200\) total cars. The median is the average of the \(100^{th}\) and \(101^{st}\) values. From the boxplot for Country A, \(Q_3\) is \(24\) mpg, so at least \(75\%\) of its \(100\) cars (\(75\) cars) are \(\le 24\) mpg. From the boxplot for Country B, \(Q_1\) is \(24\) mpg, so at least \(25\%\) of its \(100\) cars (\(25\) cars) are \(\le 24\) mpg. In the combined set, this means at least \(75 + 25 = 100\) cars have a mileage less than or equal to \(24\) mpg, making \(24\) mpg the median.