AP Statistics 1.9 Comparisons of the Distributions for One Quantitative Variable- Exam Style Questions - MCQs - New Syllabus
Question
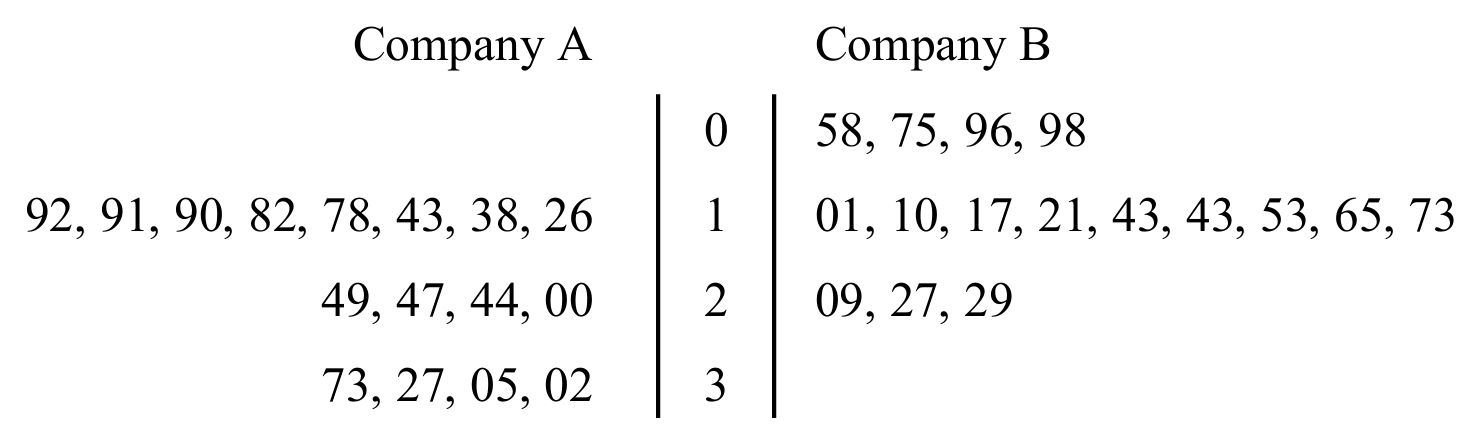
The stemplot below shows the yearly earnings per share of stock for two different companies over a sixteen-year period.

Which of the following statements is true?
(A) The median of the earnings of Company A is less than the median of the earnings of the Company B.
(B) The range of the earnings of Company A is less than the range of the earnings of Company B.
(C) The third quartile of Company A is smaller than the third quartile of Company B.
(D) The mean of the earnings of Company A is greater than the mean of the earnings of Company B.
(E) The interquartile range of Company A is twice the interquartile range of Company B.
▶️ Answer/Explanation
To compare the two distributions, we can examine their quartiles. Each company has 16 observations, so the third quartile \(Q_3\) is the median of the upper half of the ordered data.
For Company A, the ordered data give:
\( Q_3 = 249 \)
For Company B, the ordered data give:
\( Q_3 = 173 \)
Therefore, Company A’s third quartile is actually larger than Company B’s, so choice (C) is false.
Checking the remaining statements shows that the median of Company A is less than the median of Company B.
Company A median: \( \frac{143+178}{2}=160.5 \)
Company B median: \( \frac{143+153}{2}=148 \)
This shows (A) is not true. Continuing the comparisons, the only statement that is correct is that the mean of Company A exceeds the mean of Company B because Company A contains several much larger values in the upper tail.
✅ Answer: (D)
Question

(B) Country B has a higher median and a larger interquartile range than Country A.
(C) Country A has a higher median, but Country B has a larger interquartile range.
(D) Country B has a higher median, but Country A has a larger interquartile range.
▶️ Answer/Explanation
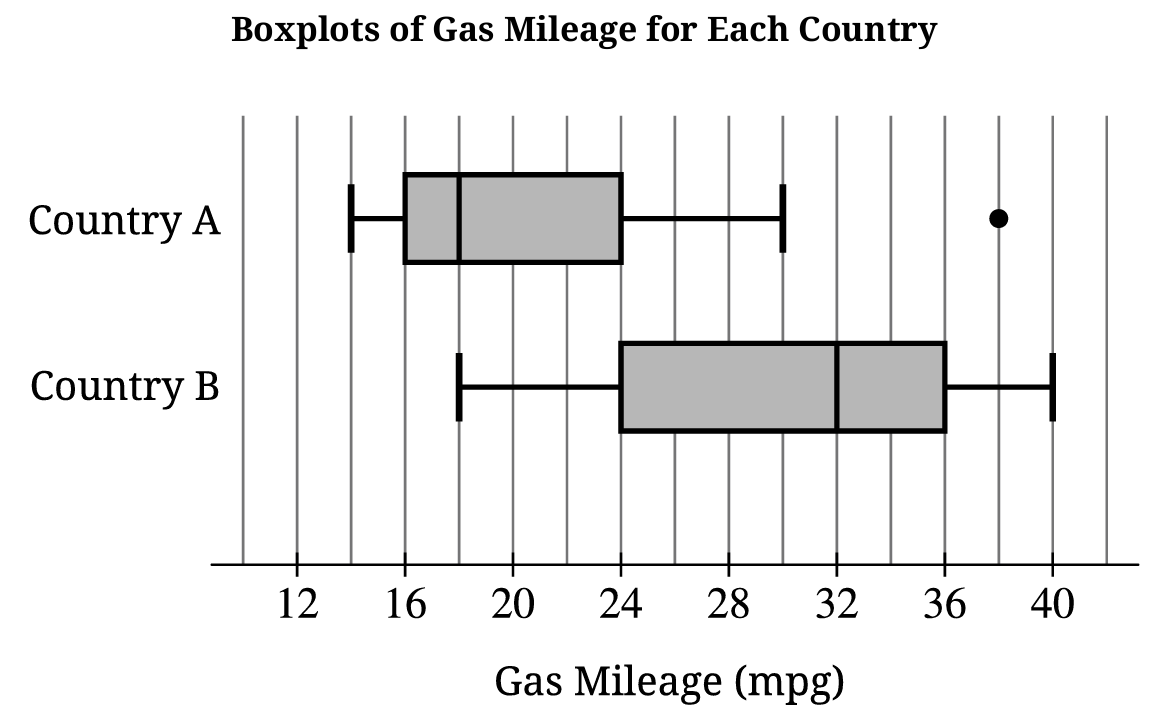
From the boxplots, the median for Country A is approximately \(18\,\text{mpg}\), while the median for Country B is approximately \(32\,\text{mpg}\). Therefore, Country B has the higher center.
The interquartile range for Country A is approximately \(22-14=8\,\text{mpg}\).
The interquartile range for Country B is approximately \(36-24=12\,\text{mpg}\).
Since \(12\,\text{mpg} > 8\,\text{mpg}\), Country B also has the larger interquartile range.
✅ Answer: (B)
Question

(B) The median reduction is \(0\,\text{mmHg}\) for the dark chocolate group and \(7\,\text{mmHg}\) for the white chocolate group; the white chocolate group has the greater median reduction.
(C) The median reduction is \(6.08\,\text{mmHg}\) for the dark chocolate group and \(0.42\,\text{mmHg}\) for the white chocolate group; the dark chocolate group has the greater median reduction.
(D) The two groups have the same median reduction because the dotplots overlap.
▶️ Answer/Explanation

From the dotplots, the median reduction in blood pressure for the dark chocolate group is \(7\,\text{mmHg}\), and the median reduction for the white chocolate group is \(0\,\text{mmHg}\).
Since \(7>0\), the dark chocolate group has the greater median reduction in blood pressure.
Choice (C) uses the sample means, not the medians. The means are \(\bar{x}_{\text{dark}}=6.08\) and \(\bar{x}_{\text{white}}=0.42\), but the question asks for medians.
✅ Answer: (A)
