▶️ Answer/Explanation
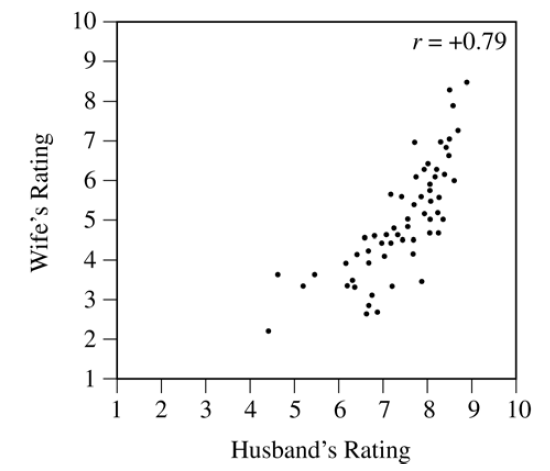
1. Analyze the Scatterplot with a Line of Equality:
Imagine a line where the wife’s rating equals the husband’s rating (the line \(y=x\)).
– Points **on** this line represent couples who gave the same rating.
– Points **below** this line represent couples where the husband’s rating (x-axis) was higher than the wife’s rating (y-axis).
– Points **above** this line represent couples where the wife’s rating was higher than the husband’s.
2. Observe the Pattern:
By visually inspecting the scatterplot, it is clear that there are significantly more points below the line \(y=x\) than above it. This shows a clear pattern or tendency.
3. Evaluate the Statement:
The fact that most points are below the line of equality directly supports the statement that “Husbands **tended to** rate the quality of living higher than their wives did.” The phrase “tended to” correctly describes this overall pattern rather than a rule that applies to every single couple.
✅ Answer: (A)