AP Statistics 2.12 Sampling Distributions and the Central Limit Theorem- Exam Style Questions - MCQs - New Syllabus
Question
According to the U.S. Census Bureau, the population distribution of household incomes for American households is skewed to the right. Imagine taking many random samples of size \( n = 500 \) households from this population distribution. Describe the shape and spread of the sampling distribution of \( \bar{X} \).
(A) The shape and spread of the sampling distribution would be roughly the same as the shape and spread of the population distribution.
(B) The shape of the sampling distribution would be roughly the same as the shape of the population, but the spread of the sampling distribution would be larger than the spread of the population.
(C) The shape of the sampling distribution would be roughly the same as the shape of the population, but the spread of the sampling distribution would be smaller than the spread of the population.
(D) The shape of the sampling distribution would be approximately Normal, and the spread of the sampling distribution would roughly the same as the spread of the population.
(E) The shape of the sampling distribution would be approximately Normal, and the spread of the sampling distribution would be smaller than the spread of the population.
▶️ Answer/Explanation
Even though the population distribution of household income is skewed to the right, the sample size is very large (\(n = 500\)). By the Central Limit Theorem, the sampling distribution of the sample mean \( \bar{X} \) will be approximately Normal.
The spread of the sampling distribution is measured by the standard error:
\( SE_{\bar{X}} = \frac{\sigma}{\sqrt{n}} \)
Since \( \sqrt{n} > 1 \), the standard error is smaller than the population standard deviation. Therefore, the sampling distribution is more concentrated around the mean than the original population distribution.
✅ Answer: (E)
Question

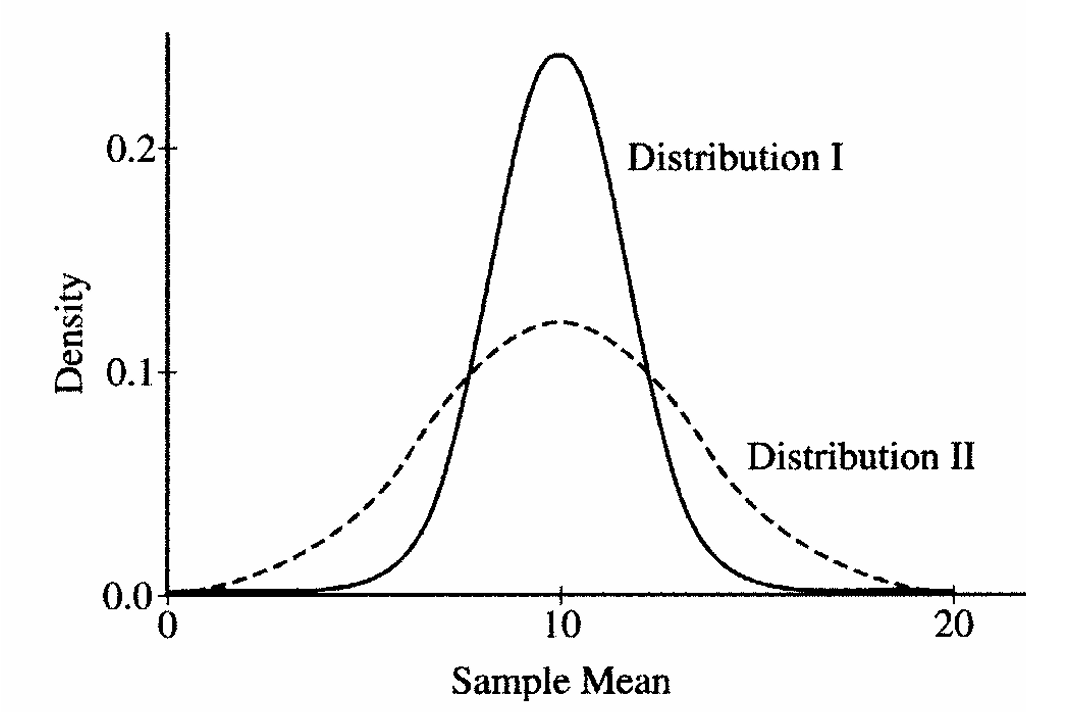
The graphs of the sampling distributions, I and II, of the sample mean of the same random variable for samples of two different sizes are shown below. Which of the following statements must be true about the sample sizes?
(A) The sample size of I is less than the sample size of II.
(B) The sample size of I is greater than the sample size of II.
(C) The sample size of I is equal to the sample size of II.
(D) The sample size does not affect the sampling distribution.
(E) The sample sizes cannot be compared based on these graphs.
▶️ Answer/Explanation
Both sampling distributions are centered at the same mean, but Distribution I is much narrower and more concentrated around the center than Distribution II.
The standard deviation of the sampling distribution of the sample mean is:
\( \sigma_{\bar{x}}=\frac{\sigma}{\sqrt{n}} \)
As the sample size \(n\) increases, the standard error decreases, causing the sampling distribution to become narrower and more concentrated around the population mean.
Since Distribution I has a smaller spread than Distribution II, it must correspond to the larger sample size.
Therefore,
\( n_I > n_{II} \)
✅ Answer: (B)
Question
(B) \(0.198\)
(C) \(0.274\)
(D) \(0.576\)
▶️ Answer/Explanation
The mean of the sampling distribution is
\(\mu_{\bar{x}}=300\).
The standard deviation of the sampling distribution is
\(\sigma_{\bar{x}}=\dfrac{\sigma}{\sqrt{n}}=\dfrac{5}{\sqrt{2}}\approx3.535\).
Now standardize:
\(P(\bar{X}>303)=P\left(Z>\dfrac{303-300}{3.535}\right)\)
\(P(\bar{X}>303)=P(Z>0.849)\)
Using the standard normal distribution:
\(P(Z>0.849)\approx0.198\).
A sample mean of \(303\,\text{mg}\) or greater would occur about \(19.8\%\) of the time when the machine is working properly, so it is not unusual.
✅ Answer: (B)
